This page takes the OFDM modulator away from its defaults. Four lines switch on a DC null and a pilot port, and those four lines change how many values you have to supply. The listing then takes one symbol apart stage by stage, and every stage is plotted.
- What does this example change from the default ?
- How does the code take one symbol apart ?
- How does the loop remove the pilots and the DC position ?
- Why is every input value the same ?
- What does this example leave out ?
What does this example change from the default ?
Four lines at the top of the listing do all of it. Two of them switch on features the OFDM Modulator page left false, and the third decides where the pilots go. The fourth reads back the consequence, which is the number that matters.
InsertDCNull forces the centre position to zero, so one position stops carrying data. PilotInputPort opens a second input, and PilotCarrierIndices names the four positions that input feeds. Every position given to a pilot is a position taken from the payload, so the four pilots cost four more.
The arithmetic runs down from the default in three steps. The default leaves 53 positions after the guard bands. The DC null takes one and leaves 52. The four pilots take four more and leave 48, which is what info() now reports as DataInputSize. Figure 1 draws the whole map.
Figure 1. The 64 positions of one symbol under these settings. Only the blue cells come from dataIn, which is why the input is 48 values long rather than 53. The pilot positions are the author's choice rather than a standard pattern.
48 is the payload of an 802.11a symbol : the defaults describe a Wi-Fi symbol with DC and pilots still carrying data. These four lines complete it, and the modulator page works through where 64, [6;5] and 16 come from.The pilots sit symmetrically about DC : positions 14, 24, 42 and 52 are subcarriers -19, -9, +9 and +19. Symmetry is sensible and it is not required, and 802.11a places its four pilots at plus and minus 7 and 21 instead.Read DataInputSize, never count the positions yourself : three separate settings feed into it here, and info() is the only thing that tracks all three.
How does the code take one symbol apart ?
The listing runs the full round trip and plots seven stages of it. Read the titles on the panels before the code. Each title names exactly what has been removed by that point, and the x-axis lengths count what is left.
hMod = comm.OFDMModulator;
hMod.InsertDCNull = true;
hMod.PilotInputPort = true;
hMod.PilotCarrierIndices =[14; 24; 42; 52];
hModInfo = info(hMod);
rng(0);
dataIn = complex(ones(hModInfo.DataInputSize),ones(hModInfo.DataInputSize));
PilotIn = 1.5 * complex(ones(length(hMod.PilotCarrierIndices),1), ...
ones(length(hMod.PilotCarrierIndices),1));
modData = step(hMod,dataIn,PilotIn);
modDataNoCP = modData(length(modData)-hMod.FFTLength+1:length(modData));
modDataNoCPfft = fftshift(fft(modDataNoCP));
indicesOfPilotAndDC = [hMod.PilotCarrierIndices ; length(modDataNoCPfft)/2+1];
indicesWoPilotAndDC = [ ];
for i = 1:length(modDataNoCPfft)
if ismember(i, indicesOfPilotAndDC) == 0
indicesWoPilotAndDC = [indicesWoPilotAndDC i];
end;
end;
modDataNoCPfftNoPilotDC = modDataNoCPfft(indicesWoPilotAndDC);
modDataNoCPfftNoPilotDcNoGB = modDataNoCPfftNoPilotDC(hMod.NumGuardBandCarriers(1)+1 : ...
length(modDataNoCPfftNoPilotDC) - hMod.NumGuardBandCarriers(2));
hDeMod = comm.OFDMDemodulator(hMod);
hDeModInfo = info(hDeMod);
[deModData,PilotOut] = step(hDeMod, modData);
subplot(7,1,1);
stem(abs(dataIn));xlim([1 length(dataIn)]);
title('Input Data');
set(gca,'xtick',[1 length(dataIn)]);
subplot(7,1,2);
stem(abs(modData));xlim([1 length(modData)]);
title('Mod Data');
set(gca,'xtick',[1 length(modData)]);
subplot(7,1,3);
stem(abs(modDataNoCP));xlim([1 length(modDataNoCP)]);
title('Mod Data - CP Removed');
set(gca,'xtick',[1 length(modDataNoCP)]);
subplot(7,1,4);
stem(abs(modDataNoCPfft));xlim([1 length(modDataNoCPfft)]);
title('ShiftFft(FFT(Mod Data - CP Removed))');
set(gca,'xtick',[1 length(modDataNoCPfft)]);
subplot(7,1,5);
stem(abs(modDataNoCPfftNoPilotDC));xlim([1 length(modDataNoCPfftNoPilotDC)]);
title('ShiftFft(FFT(Mod Data - CP Removed)) -Pilot/DC Removed');
set(gca,'xtick',[1 length(modDataNoCPfftNoPilotDC)]);
subplot(7,1,6);
stem(abs(modDataNoCPfftNoPilotDcNoGB));xlim([1 length(modDataNoCPfftNoPilotDcNoGB)]);
title('ShiftFft(FFT(Mod Data - CP Removed)) - Pilot/DC/GuardBand Removed');
set(gca,'xtick',[1 length(modDataNoCPfftNoPilotDcNoGB)]);
subplot(7,1,7);
stem(abs(deModData));xlim([1 length(deModData)]);
title('Demod Data');
set(gca,'xtick',[1 length(deModData)]);
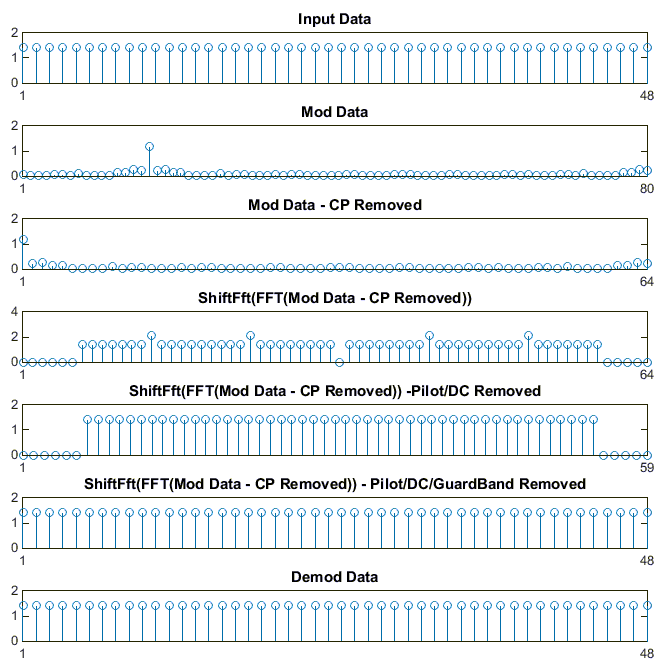
Figure 2. Seven stages of one symbol, with each x-axis counting what survives to that point : 48, 80, 64, 64, 59, 48, 48. The fourth panel is the map of Figure 1 measured from the signal rather than drawn by hand.
Panel 4 is Figure 1, measured rather than drawn : six zeros at the low end, five at the high end and one at the centre. Four stems stand taller than the rest, and the remaining 48 sit at one height. Every setting made at the top of the listing appears in that one panel.The pilots are taller because PilotIn is 1.5 times dataIn : the data values have magnitude near 1.41 and the pilots near 2.12. The four pilot positions are therefore visible without a label.Panel 5 still has its guard bands : it runs to 59 rather than 64 because the five interior positions have gone. The six zeros and five zeros at the ends stay until panel 6.Panels 1, 6 and 7 are the same picture : 48 equal stems in all three. The hand built chain agrees with step(), and both return what was sent.
The three frequency domain panels come off in a deliberate order. Panel 4 is everything, 64 positions. Panel 5 removes the four pilots and the DC position and leaves 59. Panel 6 removes the two guard bands and leaves 48. Only the last of those matches what the demodulator returns, which panel 7 confirms.
Panels 2 and 3 look nothing like the waveform on the OFDM Modulator page, and the input explains why. All 48 data values are identical here, so the spectrum is nearly flat, and a flat spectrum transforms into a single spike in time. Panel 2 carries one stem near 1.3 with everything else below 0.3, and the tallest sample in panel 3 is its first one.
That is the peak to average power ratio problem at its most extreme, produced here by accident. A transmit amplifier handed this waveform would spend almost all of its time near zero and would still have to stay linear at the spike. Real systems avoid the case by carrying data that differs from one subcarrier to the next. Random input gives you that, and a row of ones does not.
How does the loop remove the pilots and the DC position ?
Five positions have to come out of the middle of a 64 point array, and they are not next to each other. A slice cannot express that, which is why the listing builds an index list instead. This is the least obvious part of the code and the part worth reading twice.
The first line collects the five indices into one column : the four pilot positions, and the DC position appended after them. Notice that the DC index is calculated rather than typed. After fftshift the DC bin of an even length array sits at length divided by two, plus one, which is 33 here. Writing 33 would break the moment FFTLength changed.
The loop then walks the whole array and keeps every index the list does not contain, so indicesWoPilotAndDC ends 59 entries long. Matlab has setdiff for exactly this, and one call would replace the five lines. The loop spells out what that call means, which is reasonable in an example written to be read.
The last line trims the guard bands off what remains, and it takes positions 7 through 54. That arithmetic hides an assumption worth stating. All five removed indices lie strictly between the guard bands. The six low guards therefore keep positions 1 to 6, and the five high guards move down to 55 to 59. Put a pilot at position 4 and the count still comes to 48, and the wrong 48.
Scattered positions need an index list, not a slice : the pilots sit at 14, 24, 42 and 52, with the DC null at 33. No single range covers everything that has to stay.The DC index is derived from the array length : length over two plus one is where fftshift leaves DC for an even length. The line therefore still works after a change of FFTLength.Order matters, and the code relies on it silently : interior positions come out first and the guard bands second. That works only because every interior removal sits between the two guard bands.
Why is every input value the same ?
The two example pages before this one fill their input with randn, and this one fills it with ones. That change is deliberate, and it is what makes the fourth panel readable at all.
The call complex(ones, ones) gives every data value 1 + 1i, whose magnitude is the square root of 2, or about 1.41. The pilot line multiplies the same pattern by 1.5, so every pilot has magnitude about 2.12. Two constants, one larger than the other.
The benefit appears in panel 4. When the data is constant, anything in a frequency domain plot that is not constant has to be structure rather than content. A stem at zero is a guard band or the DC null, and a taller stem is a pilot. Random data would hide all of that, and the panel would teach you nothing.
One line in the listing does nothing as a result. The rng(0) call fixes the random seed, and nothing in this example is random. It therefore has no effect here. It is a leftover from the pages that do use randn, and it is harmless.
A constant input turns the plot into a map : every departure from one height is structure the settings created. That is why this page can show its subcarrier layout and the other two cannot.The 1.5 factor is there to be seen : it has no meaning as a pilot amplitude. It separates the pilots from the data by eye, which is the whole job it was given.The same choice ruins the time domain panels : a flat spectrum gives an impulse. Panels 2 and 3 therefore show a test pattern rather than anything a transmitter would send.
What does this example leave out ?
Pilots exist to let a receiver measure a channel. This example switches them on, plots them, and never uses them for anything, because there is no channel here to measure.
Look at the demodulator call. It returns two things, deModData and PilotOut, and the listing plots only the first. PilotOut would hold the four pilot values as they arrived. With the modulator wired straight to the demodulator, they arrive exactly as they were sent. Comparing them against PilotIn would give four ratios of one.
Those four ratios are the point of pilots in a real receiver. Each one measures what the channel did at that subcarrier, and interpolating between them estimates what it did everywhere else. That estimate is what an equalizer divides out, and channel estimation covers how the interpolation is done. None of it can be demonstrated without a channel.
One smaller gap is worth closing if you run this code yourself. Nothing compares deModData with dataIn numerically, and panels 1 and 7 are judged identical by eye. A single line settles it : max(abs(deModData - dataIn)). Expect a number near the floating point noise floor rather than zero, because the transform pair is not exact in arithmetic.
The two pages this one extends are OFDM Modulator and OFDM DeModulator, which run the same chain at its defaults. For the theory rather than the toolbox call, OFDM covers the subject on its own.
PilotOut is returned and never read : the second output of the demodulator carries the four received pilots. Nothing in the listing plots or checks them.Pilots do nothing without a channel : here they arrive exactly as they were sent, so every measurement they could provide comes out as one.Check the round trip with arithmetic, not with your eyes : two stem plots at the same height are weak evidence. One max of an absolute difference is strong evidence.Everything hard is still missing : no channel, no noise and no synchronisation. That is where the other two pages in this set also stop.