Matlab Toolbox - 4G/LTE
There are many different types of Reference Signal that may confuse a lot of people including me. It is confusing not only in terms of too many different types but also in terms of terminology refering to those reference signal. Refer to Downlink Reference Signal page and have good understanding of various types of Reference Signal. In this example, I will deal with only Cell Specific Reference signal (p0~p3, mostly p0 only for simplicify).
The Cell Specific Reference Signal is the signal the UE measures and estimates the channel with, so it sits in every downlink subframe across the whole bandwidth. This page generates the RS values with lteCellRS, finds their positions with lteCellRSIndices, and places them in a subframe grid.
Followings are the topics to be covered in this page.
- SISO - RS Symbol Generation
- SISO - RS Position - RE Mapping
- How does the RS position depend on the PCI ?
- Reference
SISO - RS Symbol Generation
The first question is what the RS values look like. The code below asks lteCellRS for the port 0 values of one subframe, and lteCellRSIndices for their positions, and plots both.
% Since RS is determined by each eNodeB, you have to define properites of a eNodeB.
% NDLRB indicate System Bandwith in the unit of RBs.
% NDLRB 6 = 1.4 Mhz, NDLRB 15 = 3.0 Mhz, NDLRB 25 = 5.0 Mhz,
% NDLRB 50 = 10 Mhz, NDLRB 75 = 15 Mhz, NDLRB 100 = 20 Mhz
% CellRefP indicate number of downlink Antenna. CellRefP = 1 means 1 transmission antenna (SISO)
% NCellID indicate PCI (Physical Cell Identity) of the Cell
% NSubframe indicate the subframe number.
enb.CyclicPrefix = 'Normal';
enb.NDLRB = 6;
enb.CellRefP = 1;
enb.DuplexMode = 'FDD';
enb.NCellID = 10;
enb.NSubframe = 1;
% Then pass the eNodeB definition to lteCellRS() with a specific antenna port number,
% it would give you the list of Cell Specific Reference Signal. '0' in lteCellRS(enb,0) means 'antenna port 0'.
% lteCellRSIndices() gives you the list of RE (Resource Element) number within the whole subframe.
rsAnt0 = lteCellRS(enb,0);
indAnt0 = lteCellRSIndices(enb,0);
indAnt0_arrayIndex = 0:length(indAnt0)-1;
% Following is to represent RS symbols.
subplot(2,3,1);
plot(real(rsAnt0),imag(rsAnt0),'ro','MarkerFaceColor',[1 0 0]);
title('Constellation');
subplot(2,3,[2 3]);
plot(indAnt0,real(rsAnt0),'ro-',indAnt0,imag(rsAnt0),'bo-');
xlim([0 (enb.NDLRB * 12 * 14)]);
title('RS index(RE index) vs RS. Red -> real, Blue -> Imaginary');
subplot(2,3,[4 6]);
plot(indAnt0_arrayIndex,real(rsAnt0),'ro-',indAnt0_arrayIndex,imag(rsAnt0),'bo-');
title('RS Number vs RS. Red -> real, Blue -> Imaginary');
xlim([0 max(indAnt0_arrayIndex)]);
As you see on the left side of the graph, Cell Specifi Refence signal is a sequence data modulated in QPSK. Right side graph is the I and Q data of Reference signal plotted over resource element number of the subframe (1 subframe/ 1 ms). Here, you see the reference signal appears only on certain locations (specific RE number). The bottom plot is the one that expanded the initial portion of the sequence graph.
|
enb.NDLRB = 6; enb.CellRefP = 1; enb.NCellID = 10; enb.NSubframe = 0; |
|
|
|
|
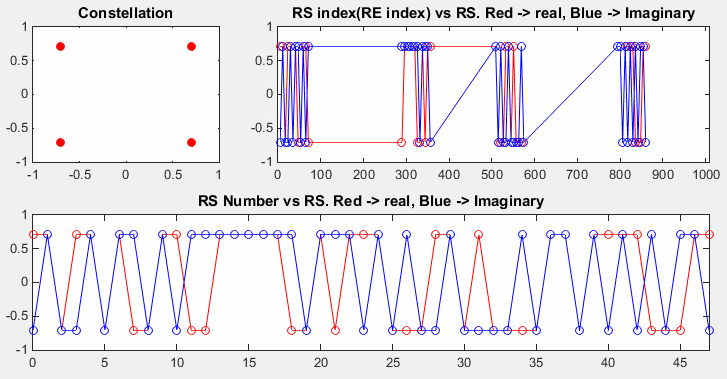
Port 0 RS of one subframe with NDLRB = 6. The four constellation points sit at ±0.707 ± j0.707. The RE index axis ends at 1008, which is 72 subcarriers times 14 symbols.
QPSK with amplitude 1 : each value is (±1 ± j)/√2.Four groups on the RE index axis : one for each OFDM symbol that carries RS on port 0.48 RS in the subframe : 2 per RB per symbol, times 6 RB, times 4 symbols.
The values follow 36.211 v19.3.0 clause 6.10.1.1. Each RS symbol is built from two bits of the pseudo-random sequence of clause 7.2, one for the real part and one for the imaginary part, and scaled by 1/√2. The generator restarts at every OFDM symbol, with an initial value that combines the slot number, the symbol number, NIDcell and the cyclic prefix type. So the values change from symbol to symbol and from cell to cell.
The code block sets NCellID = 10 and NSubframe = 1, while the table next to the plot lists NSubframe = 0. The RS values depend on the slot number, so the two settings give different sequences with the same constellation. The positions on the RE index axis do not depend on the subframe, and the constellation looks the same in both cases.
Pseudo-random QPSK : two bits of c(n) per RS symbol.New values in every symbol : the generator restarts with the slot and symbol number.Values depend on NSubframe : positions do not.
SISO - RS Position - RE Mapping
Now I will plot the reference signal onto radio subframe grid to give you more intuitive understanding on how the reference signal scattered over a radio frame.
% Since RS is determined by each eNodeB, you have to define properites of a eNodeB.
% NDLRB indicate System Bandwith in the unit of RBs.
% NDLRB 6 = 1.4 Mhz, NDLRB 15 = 3.0 Mhz, NDLRB 25 = 5.0 Mhz,
% NDLRB 50 = 10 Mhz, NDLRB 75 = 15 Mhz, NDLRB 100 = 20 Mhz
% CellRefP indicate number of downlink Antenna. CellRefP = 1 means 1 transmission antenna (SISO)
% NCellID indicate PCI (Physical Cell Identity) of the Cell
% NSubframe indicate the subframe number.
enb.CyclicPrefix = 'Normal';
enb.NDLRB = 6;
enb.CellRefP = 1;
enb.DuplexMode = 'FDD';
enb.NCellID = 0;
enb.NSubframe = 0;
% To display anything on a OFDMA Grid, we need to create an empty grid as shown below.
% lteDLResourceGrid(enb) will give you the one subframe grid according to the specified eNB configuration.
resourceGrid = lteDLResourceGrid(enb);
% In following lines, lteCellRS(enb,0) generate RS symbol data,
% lteCellRSIndices(enb,0) gives you RE index (location of REs for Reference Signal).
% by resourceGrid(indAnt0) = rsAnt0, RS symbol data is assigned to corresponding Resource Element
rsAnt0 = lteCellRS(enb,0);
indAnt0 = lteCellRSIndices(enb,0);
resourceGrid(indAnt0) = rsAnt0;
% Following is to generate and allocate PSS, SSS onto the resource grid. In real life, UE need to detect PSS,
% SSS first and then calculate PCI (Physical Cell ID) from the PSS,SSS. Using this PCI, the location of RS is
% calculated.
% the variable pss_scale and sss_scale in this example is used only to allocate different color onto the specified
% resource element. They are not the parameter you would see in real life.
pss_scale = 0.2;
sss_scale = 0.4;
pss = ltePSS(enb);
pss_arrayIndex = 0:length(pss)-1;
pss_sym_ind = ltePSSIndices(enb,0,{'1based','re'});
resourceGrid(pss_sym_ind) = pss_scale;
sss = lteSSS(enb);
sss_arrayIndex = 0:length(sss)-1;
sss_sym_ind = lteSSSIndices(enb,0,{'1based','re'});
resourceGrid(sss_sym_ind) = sss_scale;
% Following is to display the resource grid. I didn't find any proper functions in the toolbox to display
% one subframe grid as I like. So I used a little bit of tricks. First I plot 3D surface graph with the grid and
% move the view point right on top of the plot so that it looks like plane 2D grid.
xStep = 0:13;
yStep = 0:(enb.NDLRB*12-1);
surface(xStep,yStep,abs(resourceGrid));
axis([0 13 0 (enb.NDLRB*12-1) 0 1]);
view([0,90]);
set(gca,'xtick',[0 6 7 13]);
set(gca,'ytick',[[0:12:enb.NDLRB*12-1] [enb.NDLRB*12-1]]);
Following is two example for RS display in a subframe with 1.4 Mhz System Bandwidth. Since this is subframe 0 (NSubframe = 0), you see PSS, SSS. The RS is marked in Yellow. If you compare the two examples, you would notice that the location of RS varies with PCI (NCellID).
|
enb.NCellID = 0; enb.NSubframe = 0; enb.NDLRB = 6; |
enb.NCellID = 1; enb.NSubframe = 0; enb.NDLRB = 6; |
|
|
|
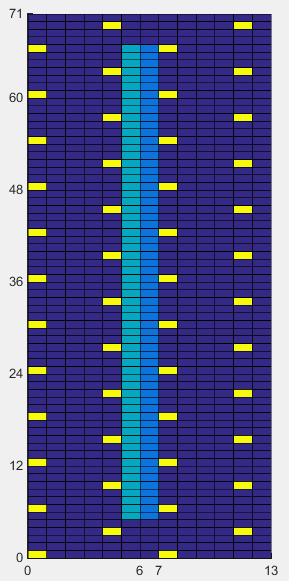
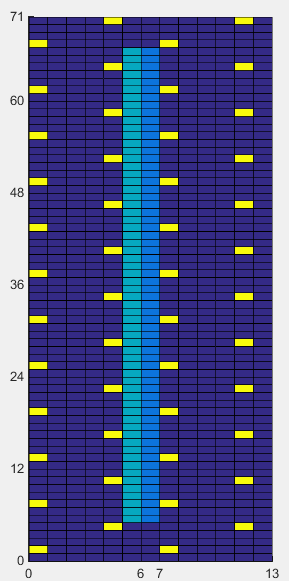
1.4 MHz, NCellID 0 and NCellID 1. RS in yellow in symbols 0, 4, 7 and 11. The SSS and PSS fill the central 62 subcarriers of symbols 5 and 6.
Following is two example for RS display in a subframe with 5 Mhz System Bandwidth. Since this is subframe 0 (NSubframe = 0), you see PSS, SSS. The RS is marked in Yellow. If you compare the two examples, you would notice that the location of RS varies with PCI (NCellID).
|
enb.NCellID = 0; enb.NSubframe = 0; enb.NDLRB = 25; |
enb.NCellID = 1; enb.NSubframe = 0; enb.NDLRB = 25; |
|
|
|
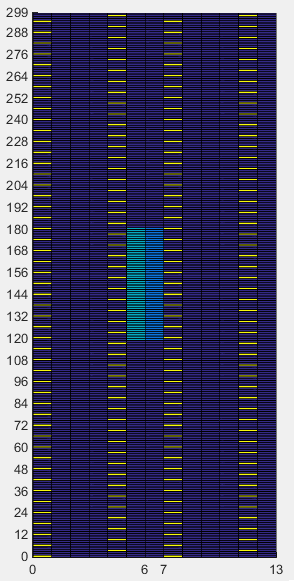
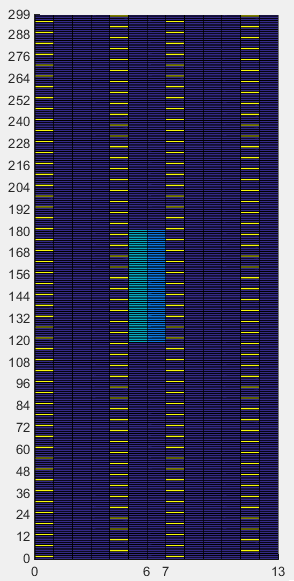
5 MHz, NCellID 0 and NCellID 1. The RS pattern repeats over all 300 subcarriers, while the PSS and SSS stay in the central 72.
RS in symbols 0, 4, 7 and 11 : symbols 0 and 4 of each slot for port 0.Every sixth subcarrier : with symbols 4 and 11 offset by three subcarriers from symbols 0 and 7.NCellID 1 moves the pattern up by one subcarrier : compared with NCellID 0.
The code places the PSS and SSS only to show where they sit. It writes pss_scale and sss_scale into their positions rather than the real values, so they appear as fixed colours. The call for the SSS values used ltePSS, which the code now corrects to lteSSS. The PSS and SSS pages generate the real values.
How does the RS position depend on the PCI ?
The page ends with a question: does every PCI give a different RS position? The answer is no. Only six positions exist, and the PCI picks one of them.
If you have the Tool Box, try with more PCI. Does every PCI allocated different RS location ? or is there any pattern or rule for RS location and PCI ? (See Reference Signal : Downlink page )
36.211 clause 6.10.1.2 places port 0 RS on subcarrier k = 6m + (v + vshift) mod 6. Here v is 0 in symbol 0 and 3 in symbol 4 of each slot. The cell-specific shift is vshift = NIDcell mod 6. So PCI 0 and PCI 6 share the same RS positions, and PCI 1 moves every RS up by one subcarrier, as the plots above show.
Neighbour cells therefore plan their PCIs so that their mod 6 values differ, and their RS do not land on the same resource elements. Cells with the same mod 6 value still send different RS values, because the pseudo-random sequence depends on the full PCI. With CellRefP = 2, port 1 uses the offset that port 0 leaves free in the same symbols. With CellRefP = 4, ports 2 and 3 add RS in symbol 1 of each slot.
vshift = PCI mod 6 : six possible RS positions.PCI 0 and PCI 6 share positions : but not values.Mod 6 planning : keeps neighbour RS off the same resource elements.
Disclaimer !
This page is only to show you the overall logics and visualization for various LTE physical layer channels. I haven't investigated much about verifying about the accuracy.
If you think the code is not so efficient, it is 100% my fault. I haven't made any effort for effiecient code. I just tried to create code as simple as possible for the readers. As you know, easy-to-read code is not always efficient for a specific chipset.
If you find any mistake in terms of accuracy, it is also very highly likely be my fault. Not the problem of Matlab tool box itself.
Any comment and corrections if you find any mistake will be welcome and appreciated.
Reference
[1] 3GPP TS 36.211 v19.3.0 - clause 6.10.1, Cell-specific reference signals
[2] Reference Signal : Downlink