This page is a kind of extension of previous tutorial : LTE UL(SC-FDMA) Demodulation (without DMRS Analysis). In the previous tutorial, we had two important factors as given.
i) Timing Synchronization
ii) Phase Compensation after demodulation
In this page, I will show you how to find items (actually both Phase and Amplitude compensation) from PUSCH DMRS data. The I/Q Data used here is also generated by a real hardware (Vector signal generator) and captured by Vector Signal Analyzer with special Sync signal. So you don't have to implement an algorithm for synchronization and a lot of compensation which is a too much for an example. If you are interested in working as beginner level of LTE DSP, this can be helpful or motivation as well.
The receiver knows the DMRS that the UE sent, because the cell identity and the slot number fix it. Dividing the received DMRS by the known one gives the channel on each subcarrier, and that estimate then corrects the data symbols of the same slot. This page does that for a PUSCH of one RB.
Followings are the topics to be covered in this page.
Result
How much does one DMRS symbol improve the demodulation? The figure below puts the result without the DMRS next to the result with it, for the seven SC-FDMA symbols of slot 0. Each row is one symbol, and the left and right halves of the figure are the two cases.
Following is the result of the Matlab source code listed here. (A) shows the magnitude of the IFFT result for each symbols within the first slot of subframe 0 and this is the case that is not compensated with DMRS. (B) is the I/Q plot (real and imaginary) representation of column (A). (C) shows the magnitude of the IFFT result for each symbols within the first slot of subframe 0 after compensation (Equalization) with DMRS. (D) is the I/Q plot (real and imaginary) representation of column (C).
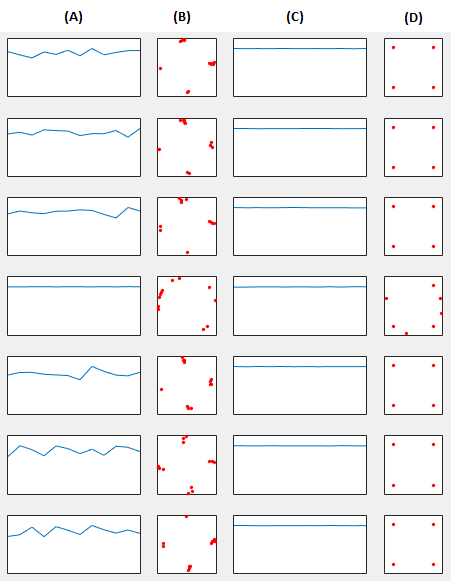
Columns (A) and (B) are before equalization, and columns (C) and (D) are after it. The fourth row is the DMRS symbol itself.
Before equalization : the magnitude in column (A) ripples, and the points in column (B) spread around rotated clusters.After equalization : the magnitude in column (C) is flat, and column (D) shows four clean QPSK points.Fourth row, the DMRS : flat in columns (A) and (C), and several points around a circle in columns (B) and (D).
The fourth row shows why the equalization works. Its column (A) is flat, so the received DMRS has the same magnitude on all 12 subcarriers. The channel therefore changes mainly the phase across the RB, not the amplitude. A phase that changes from one subcarrier to the next, such as the phase slope of a small timing offset, mixes neighbouring QPSK symbols after the IFFT. That mixing is the ripple in column (A) and the spread in column (B).
The DMRS row is not transform precoded, so the code skips the IFFT for it. Column (D) then shows the DMRS sequence itself, with its points on a circle rather than on the four QPSK positions. The DMRS - PUSCH - 1RB page shows the same sequence for Cell ID 0.
The DMRS magnitude is flat : the channel mostly rotates the phase across the RB.The ripple comes from the phase slope : the IFFT mixes neighbouring symbols when the phase is not corrected.One DMRS symbol corrects the slot : all six data symbols use the same estimate.
LTE Configuration of the Data
The configuration list has two halves. The first four items are enough for demodulation, and the last three fix the DMRS sequence that the equalization compares against.
The data that I used in this example is from following LTE Configuration. If you don't consider the compensation process (Equalization Process), only the first four items would be important. The last three parameters are for DMRS analysis. The number of RB and StartRB is for both Demodulation and Compensation process.
- System BandWidth = 5 Mhz
- Sampling Rate = 7.68 Mhz
- Number of RB = 1
- Start RB = 0
- Physical Cell ID = 0
- Subframe Number = 0
- Slot Number = 0
Start RB = 0 puts the RB at the lower edge of the 25 RB carrier. After the 7.5 kHz shift and fftshift, the lowest of the 300 subcarriers sits in bin 257 - 150 = 107, counting from 1. That is why the code takes bins 107 to 118. A different Start RB would move this window by 12 bins per RB.
Physical Cell ID = 0 gives group u = 0 with group hopping disabled. Slot 0 then gives ncs = 4 and α = 2π/3, as the DMRS - PUSCH - 1RB page calculates. The DMRS vector in the code matches that calculation value by value, using row 0 of 36.211 v19.3.0 Table 5.5.1.2-1.
Bins 107 to 118 : Start RB = 0, the lowest 12 of the 300 subcarriers.u = 0, ncs = 4 : Cell ID 0 in slot 0, with cyclicShift and the DCI cyclic shift both 0.The DMRS vector matches Table 5.5.1.2-1 : row 0, rotated by α = 2π/3 per subcarrier.
Matlab Code
The code has one new block compared with the LTE UL (SC-FDMA) Demodulation page. It demodulates the DMRS symbol first, calculates EqFactor from it, and then applies EqFactor to every symbol of the slot before the IFFT.
Following is the Matlab source code that produced the figure shown above. The code is designed intentionally long. I might have make it very short if I used for-loop, but it would look harder to understand. So I try to write every procedure step by step. Hopefully, this would be easier for you to follow even though it looks a little too lengthy.
clear all;
% you can download the data file in this example from here.
% this is for reading the baseband IQ data of OFDM symbol in time domain.
% detailed explantion for this three line and file format in this example is described in
% Matlab : Read Number in Binary file page.
fid = fopen('LTE_UL_5_1_CID_0_1RB_NoFilter.bin','r');
[data,count] = fread(fid, 'single');
fclose(fid);
% This variable represents the first sample in the first SCFDM symbol.
% How do I know this ? This is just a magic number I could figure out from the vector signal
% analyzer. Just think this is just a given number. If you seriously want to work in this
% area, try to implement the algorithm to find this number on your own.
Offset = 280228;
% Nfft represents the FFT size for the specified system bandwidth. 512 is the FFT size for
% 5 Mhz System Bandwidth.
Nfft = 512;
% N_RB is the number of RB assinged to this signal. N_RE is the number of Resource Elements
% in this signal and can be calculated from N_RB. This N_RE determines the IFFT size in
% demodulation process (N_RE is the size of IFFT)
N_RB = 1;
N_RE = N_RB * 12;
% SamplingScale is to figure out the number of samples in CP and OFDM Symbol for each specific system
% Bandwidth from the 20 Mhz Bandwidth. Physical Layer Parameters - FDD, Downlink will help you understand
% the meaning of each numbers here.
SamplingScale = (double(Nfft)/2048);
CP_LengthList = SamplingScale * [160;144;144;144;144;144;144];
Symbol_LengthList = SamplingScale * [2048;2048;2048;2048;2048;2048;2048];
% This is to generate a complex numbered sequence to shift the frequency of the I/Q signal by 7.5 Khz
% the number of samples of this data is same as the number of samples of each SC-FDM symbol.
Ts = 1.0/(7.68 * 10^6);
t = linspace(0,Nfft-1,Nfft);
t = t .* Ts;
Fshift = 7.5 * 1000 ;
FrequencyShift = exp(j*2*pi*Fshift*t);
%%%%%%%%%%%%%%%%%%%%%%%%%%%%% Calculate Equalization Factor %%%%%%%%%%%%%%%%%%%%%%%%%%%%%%
% This would be the main part of this tutorial. I would calculate Equalization Factor
% basically by comparing the ideal DMRS generated from the Physical Cell ID, Number of RB,
% Slot Number and the algorithm described in PUSCH DMRS page.
% In this tutorial, I manually copied DMRS data using the algorithm described in PUSCH DMRS
% with Physical Cell ID = 0, Number of RB = 1, Slot Number 0.
DMRS = [0.7071-0.7071i -0.9659+0.2588i 0.9659+0.2588i -0.7071-0.7071i -0.2588-0.9659i ...
0.9659+0.2588i 0.7071+0.7071i -0.9659+0.2588i 0.9659+0.2588i 0.7071+0.7071i ...
0.9659-0.2588i 0.9659+0.2588i];
% Taking the inverse of DMRS
DMRS_Inv = 1 ./ DMRS;
% Taking out PUSCH DMRS Symbol from the slots and Demodulate.
ChunkStart = Offset ...
+ CP_LengthList(1) + Symbol_LengthList(1) ...
+ CP_LengthList(2) + Symbol_LengthList(2) ...
+ CP_LengthList(3) + Symbol_LengthList(3) ...
+ CP_LengthList(4);
ChunkLength = Symbol_LengthList(4);
DataChunk = data((2.* ChunkStart)-1 : (2.*(ChunkStart+ChunkLength)-2));
DataChunkI = DataChunk(1:2:length(DataChunk));
DataChunkQ = DataChunk(2:2:length(DataChunk));
DataChunkComplex = DataChunkI + j*DataChunkQ;
DataChunkFFT = fftshift(fft(DataChunkComplex .* FrequencyShift'));
DataChunkFFT_RE = DataChunkFFT(107:107+(N_RE-1));
% Calculating Equalization Factor by multiplying DMRS_Inv with the demodulated DMRS.
% Very important thing : For transposing DataChunkFFT_RE don't use ('). I need just mechanical
% transposition of DataChunkFFT_RE to make the two vectors multiplicable, but if you use (')
% it does not only transpose but also taking the complex conjugate of each element, meaning
% it takes Hermitian transposition which would give you completely unexpected result in this
% case. It took me a couple hours to realize this. (I am using Matlab 2014 for this page)
EqFactor = DMRS_Inv .* transpose(DataChunkFFT_RE);
%%%%%%%%%%%%%%%%%%%%%%%%%%%%%% Demodulation of symbol 0 %%%%%%%%%%%%%%%%%%%%%%%%%%%%%%%%%%%
% This is to demoulate the symbol 0 within the slot 0 of Subframe 0.
% ChuckStart here indicates the index(position) of the first sample within the binary file.
% You would notice that I skip the first CP length. This is the same effect of removing the
% first CP as described in CP removal described in RE Map to/from Antenna page.
ChunkStart = Offset ...
+ CP_LengthList(1);
% This variable indicates the number of samples within the first OFDM symbol excluding the CP
ChunkLength = Symbol_LengthList(1);
% This is to read I/Q data pair.
DataChunk = data((2.* ChunkStart)-1 : (2.*(ChunkStart+ChunkLength)-2));
% This is to separate I and Q into a separate array (vector)
DataChunkI = DataChunk(1:2:length(DataChunk));
DataChunkQ = DataChunk(2:2:length(DataChunk));
% This is to combine I array and Q array into a complex number array.
DataChunkComplex = DataChunkI + j*DataChunkQ;
% This is to convert the time domain OFDM symbol into the frequency domain. Note that the data
% is shifted in frequency domain. Unlike the previous example : PUSCH Demodulation (without
% compensation with DMRS), I did fftshift() in this example. For me, it is easier to take out
% the subcarries allocated for allocated RB. But if you think, the previous method is easier
% for you, go for it.
DataChunkFFT = fftshift(fft(DataChunkComplex .* FrequencyShift'));
% This is to take out the data samples which will be mapped to each resource element
% within the symbol
DataChunkFFT_RE = DataChunkFFT(107:107+(N_RE-1));
% Taking the IFFT and normalize to get normalized I/Q
DataChunkFFT_IFFT = ifft(DataChunkFFT_RE);
DataChunkFFT_IFFT_Norm = DataChunkFFT_IFFT/max(abs(DataChunkFFT_IFFT));
% Plot the normalized I/Q in frequency domain. This is the data before compensation
subplot(7,6,[1 2]);
plot(abs(DataChunkFFT_IFFT_Norm));xlim([1, length(DataChunkFFT_IFFT_Norm)]); ylim([0 1.2]);
set(gca,'xticklabel',[]);set(gca,'yticklabel',[]);
set(gca,'xtick',[]);set(gca,'ytick',[]);
% Taking the IFFT and normalize to get normalized I/Q. This is a kind of duplicated process
% of the steps right above.
DataChunkFFT_RE = DataChunkFFT_RE ;
DataChunkFFT_IFFT = ifft(DataChunkFFT_RE);
DataChunkFFT_IFFT = DataChunkFFT_IFFT/max(abs(DataChunkFFT_IFFT));
DataChunkFFT_IFFT = DataChunkFFT_IFFT;
DataChunkFftMag = abs(DataChunkFFT_IFFT);
subplot(7,6,3);
plot(real(DataChunkFFT_IFFT),imag(DataChunkFFT_IFFT),'ro','MarkerFaceColor',[1 0 0],'MarkerSize',2);
xlim([-1 1]);ylim([-1 1]);
set(gca,'xticklabel',[]);set(gca,'yticklabel',[]);
set(gca,'xtick',[]);set(gca,'ytick',[]);
% Taking the IFFT and normalize to get normalized I/Q. But this one has an important
% difference comparing with the processs shown above. In this step, you see 'EqFactor'
% is multiplied before ifft(). Also, notice in this case I used "EqFactor'" rather than
% transpose(EqFactor).
DataChunkFFT_RE = DataChunkFFT_RE .* EqFactor' ;
DataChunkFFT_IFFT = ifft(DataChunkFFT_RE);
DataChunkFFT_IFFT = DataChunkFFT_IFFT/max(abs(DataChunkFFT_IFFT));
DataChunkFFT_IFFT = DataChunkFFT_IFFT;
DataChunkFftMag = abs(DataChunkFFT_IFFT);
% Plotting the I/Q in frequency Domain
subplot(7,6,[4 5]);
plot(DataChunkFftMag);xlim([1, length(DataChunkFftMag)]); ylim([0 1.2]);
set(gca,'xticklabel',[]);set(gca,'yticklabel',[]);
set(gca,'xtick',[]);set(gca,'ytick',[]);
% Plotting the I/Q in Constellation
subplot(7,6,6);
DataChunkFFT_Comp = DataChunkFFT_IFFT;
DataChunkFFT_Comp = DataChunkFFT_Comp/max(abs(DataChunkFFT_Comp));
plot(real(DataChunkFFT_Comp),imag(DataChunkFFT_Comp),'ro','MarkerFaceColor',[1 0 0],'MarkerSize',2);
xlim([-1 1]);ylim([-1 1]);
set(gca,'xticklabel',[]);set(gca,'yticklabel',[]);
set(gca,'xtick',[]);set(gca,'ytick',[]);
%%%%%%%%%%%%%%%%%%%%%%%%%%%%%% Demodulation of symbol 1 %%%%%%%%%%%%%%%%%%%%%%%%%%%%%%%%%%%
% This is to demodulate the symbol 1 within the slot 0 of Subframe 0. Everything is same
% as in the symbol 0 analysis except the 'ChunkStart. So I would not explain any further.
ChunkStart = Offset ...
+ CP_LengthList(1) + Symbol_LengthList(1) ...
+ CP_LengthList(2) ;
ChunkLength = Symbol_LengthList(2);
DataChunk = data((2.* ChunkStart)-1 : (2.*(ChunkStart+ChunkLength)-2));
DataChunkI = DataChunk(1:2:length(DataChunk));
DataChunkQ = DataChunk(2:2:length(DataChunk));
DataChunkComplex = DataChunkI + j*DataChunkQ;
DataChunkFFT = fftshift(fft(DataChunkComplex .* FrequencyShift'));
DataChunkFFT_RE = DataChunkFFT(107:107+(N_RE-1));
DataChunkFFT_IFFT = ifft(DataChunkFFT_RE);
DataChunkFFT_IFFT_Norm = DataChunkFFT_IFFT/max(abs(DataChunkFFT_IFFT));
subplot(7,6,[7 8]);
plot(abs(DataChunkFFT_IFFT_Norm));xlim([1, length(DataChunkFFT_IFFT_Norm)]); ylim([0 1.2]);
set(gca,'xticklabel',[]);set(gca,'yticklabel',[]);
set(gca,'xtick',[]);set(gca,'ytick',[]);
DataChunkFFT_RE = DataChunkFFT_RE ;
DataChunkFFT_IFFT = ifft(DataChunkFFT_RE);
DataChunkFFT_IFFT = DataChunkFFT_IFFT/max(abs(DataChunkFFT_IFFT));
DataChunkFFT_IFFT = DataChunkFFT_IFFT;
DataChunkFftMag = abs(DataChunkFFT_IFFT);
subplot(7,6,9);
plot(real(DataChunkFFT_IFFT),imag(DataChunkFFT_IFFT),'ro','MarkerFaceColor',[1 0 0],'MarkerSize',2);
xlim([-1 1]);ylim([-1 1]);
set(gca,'xticklabel',[]);set(gca,'yticklabel',[]);
set(gca,'xtick',[]);set(gca,'ytick',[]);
DataChunkFFT_RE = DataChunkFFT_RE .* EqFactor' ;
DataChunkFFT_IFFT = ifft(DataChunkFFT_RE);
DataChunkFFT_IFFT = DataChunkFFT_IFFT/max(abs(DataChunkFFT_IFFT));
DataChunkFFT_IFFT = DataChunkFFT_IFFT;
DataChunkFftMag = abs(DataChunkFFT_IFFT);
subplot(7,6,[10 11]);
plot(DataChunkFftMag);xlim([1, length(DataChunkFftMag)]); ylim([0 1.2]);
set(gca,'xticklabel',[]);set(gca,'yticklabel',[]);
set(gca,'xtick',[]);set(gca,'ytick',[]);
subplot(7,6,12);
DataChunkFFT_Comp = DataChunkFFT_IFFT;
DataChunkFFT_Comp = DataChunkFFT_Comp/max(abs(DataChunkFFT_Comp));
plot(real(DataChunkFFT_Comp),imag(DataChunkFFT_Comp),'ro','MarkerFaceColor',[1 0 0],'MarkerSize',2);
xlim([-1 1]);ylim([-1 1]);
set(gca,'xticklabel',[]);set(gca,'yticklabel',[]);
set(gca,'xtick',[]);set(gca,'ytick',[]);
%%%%%%%%%%%%%%%%%%%%%%%%%%%%%% Demodulation of symbol 2 %%%%%%%%%%%%%%%%%%%%%%%%%%%%%%%%%%%
% This is to demodulate the symbol 2 within the slot 0 of Subframe 0. Everything is same
% as in the symbol 0 analysis except the 'ChunkStart. So I would not explain any further.
ChunkStart = Offset ...
+ CP_LengthList(1) + Symbol_LengthList(1) ...
+ CP_LengthList(2) + Symbol_LengthList(2) ...
+ CP_LengthList(3);
ChunkLength = Symbol_LengthList(3);
DataChunk = data((2.* ChunkStart)-1 : (2.*(ChunkStart+ChunkLength)-2));
DataChunkI = DataChunk(1:2:length(DataChunk));
DataChunkQ = DataChunk(2:2:length(DataChunk));
DataChunkComplex = DataChunkI + j*DataChunkQ;
DataChunkFFT = fftshift(fft(DataChunkComplex .* FrequencyShift'));
DataChunkFFT_RE = DataChunkFFT(107:107+(N_RE-1));
DataChunkFFT_IFFT = ifft(DataChunkFFT_RE);
DataChunkFFT_IFFT_Norm = DataChunkFFT_IFFT/max(abs(DataChunkFFT_IFFT));
subplot(7,6,[13 14]);
plot(abs(DataChunkFFT_IFFT_Norm));xlim([1, length(DataChunkFFT_IFFT_Norm)]); ylim([0 1.2]);
set(gca,'xticklabel',[]);set(gca,'yticklabel',[]);
set(gca,'xtick',[]);set(gca,'ytick',[]);
DataChunkFFT_RE = DataChunkFFT_RE ;
DataChunkFFT_IFFT = ifft(DataChunkFFT_RE);
DataChunkFFT_IFFT = DataChunkFFT_IFFT/max(abs(DataChunkFFT_IFFT));
DataChunkFFT_IFFT = DataChunkFFT_IFFT;
DataChunkFftMag = abs(DataChunkFFT_IFFT);
subplot(7,6,15);
plot(real(DataChunkFFT_IFFT),imag(DataChunkFFT_IFFT),'ro','MarkerFaceColor',[1 0 0],'MarkerSize',2);
xlim([-1 1]);ylim([-1 1]);
set(gca,'xticklabel',[]);set(gca,'yticklabel',[]);
set(gca,'xtick',[]);set(gca,'ytick',[]);
DataChunkFFT_RE = DataChunkFFT_RE .* EqFactor' ;
DataChunkFFT_IFFT = ifft(DataChunkFFT_RE);
DataChunkFFT_IFFT = DataChunkFFT_IFFT/max(abs(DataChunkFFT_IFFT));
DataChunkFFT_IFFT = DataChunkFFT_IFFT;
DataChunkFftMag = abs(DataChunkFFT_IFFT);
subplot(7,6,[16 17]);
plot(DataChunkFftMag);xlim([1, length(DataChunkFftMag)]); ylim([0 1.2]);
set(gca,'xticklabel',[]);set(gca,'yticklabel',[]);
set(gca,'xtick',[]);set(gca,'ytick',[]);
subplot(7,6,18);
DataChunkFFT_Comp = DataChunkFFT_IFFT;
DataChunkFFT_Comp = DataChunkFFT_Comp/max(abs(DataChunkFFT_Comp));
plot(real(DataChunkFFT_Comp),imag(DataChunkFFT_Comp),'ro','MarkerFaceColor',[1 0 0],'MarkerSize',2);
xlim([-1 1]);ylim([-1 1]);
set(gca,'xticklabel',[]);set(gca,'yticklabel',[]);
set(gca,'xtick',[]);set(gca,'ytick',[]);
%%%%%%%%%%%%%%%%%%%%%%%%%%%%%% Demodulation of symbol 3 %%%%%%%%%%%%%%%%%%%%%%%%%%%%%%%%%%%
% This is to demodulate the symbol 3 within the slot 0 of Subframe 0. The symbol 3(the fourth
% symbol in LTE UL slot is special. It is special symbol carrying PUSCH DMRS data, it does
% not carry any user data. It just carries special reference signal based on a Table 5.5.1.2-1 base (not Zad-off Chu for 1 RB)
% sequence. This signal does not go through transformation procoding when it is transmitted
% so this does not go through IFFT process when it is demodulated. But I am still using the
% variable xxxx_IFFT in this step as I used for other symbols.
ChunkStart = Offset ...
+ CP_LengthList(1) + Symbol_LengthList(1) ...
+ CP_LengthList(2) + Symbol_LengthList(2) ...
+ CP_LengthList(3) + Symbol_LengthList(3) ...
+ CP_LengthList(4);
ChunkLength = Symbol_LengthList(4);
DataChunk = data((2.* ChunkStart)-1 : (2.*(ChunkStart+ChunkLength)-2));
DataChunkI = DataChunk(1:2:length(DataChunk));
DataChunkQ = DataChunk(2:2:length(DataChunk));
DataChunkComplex = DataChunkI + j*DataChunkQ;
DataChunkFFT = fftshift(fft(DataChunkComplex .* FrequencyShift'));
DataChunkFFT_RE = DataChunkFFT(107:107+(N_RE-1));
DataChunkFFT_RE_Norm = DataChunkFFT_RE/max(abs(DataChunkFFT_RE));
subplot(7,6,[19 20]);
plot(abs(DataChunkFFT_RE_Norm));xlim([1, length(DataChunkFFT_RE)]); ylim([0 1.2]);
set(gca,'xticklabel',[]);set(gca,'yticklabel',[]);
set(gca,'xtick',[]);set(gca,'ytick',[]);
DataChunkFFT_RE = DataChunkFFT_RE ;
DataChunkFFT_IFFT = DataChunkFFT_RE;
DataChunkFFT_IFFT = DataChunkFFT_IFFT/max(abs(DataChunkFFT_IFFT));
DataChunkFFT_IFFT = DataChunkFFT_IFFT;
DataChunkFftMag = abs(DataChunkFFT_IFFT);
subplot(7,6,21);
plot(real(DataChunkFFT_IFFT),imag(DataChunkFFT_IFFT),'ro','MarkerFaceColor',[1 0 0],'MarkerSize',2);
xlim([-1 1]);ylim([-1 1]);
set(gca,'xticklabel',[]);set(gca,'yticklabel',[]);
set(gca,'xtick',[]);set(gca,'ytick',[]);
DataChunkFFT_RE = DataChunkFFT_RE .* EqFactor' ;
DataChunkFFT_IFFT = DataChunkFFT_RE;
DataChunkFFT_IFFT = DataChunkFFT_IFFT/max(abs(DataChunkFFT_IFFT));
DataChunkFFT_IFFT = DataChunkFFT_IFFT;
DataChunkFftMag = abs(DataChunkFFT_IFFT);
subplot(7,6,[22 23]);
plot(DataChunkFftMag);xlim([1, length(DataChunkFftMag)]); ylim([0 1.2]);
set(gca,'xticklabel',[]);set(gca,'yticklabel',[]);
set(gca,'xtick',[]);set(gca,'ytick',[]);
subplot(7,6,24);
DataChunkFFT_Comp = DataChunkFFT_IFFT;
DataChunkFFT_Comp = DataChunkFFT_Comp/max(abs(DataChunkFFT_Comp));
plot(real(DataChunkFFT_Comp),imag(DataChunkFFT_Comp),'ro','MarkerFaceColor',[1 0 0],'MarkerSize',2);
xlim([-1 1]);ylim([-1 1]);
set(gca,'xticklabel',[]);set(gca,'yticklabel',[]);
set(gca,'xtick',[]);set(gca,'ytick',[]);
%%%%%%%%%%%%%%%%%%%%%%%%%%%%%% Demodulation of symbol 4 %%%%%%%%%%%%%%%%%%%%%%%%%%%%%%%%%%%
% This is to demodulate the symbol 4 within the slot 0 of Subframe 0. Everything is same
% as in the symbol 0 analysis except the 'ChunkStart. So I would not explain any further.
ChunkStart = Offset ...
+ CP_LengthList(1) + Symbol_LengthList(1) ...
+ CP_LengthList(2) + Symbol_LengthList(2) ...
+ CP_LengthList(3) + Symbol_LengthList(3) ...
+ CP_LengthList(4) + Symbol_LengthList(4) ...
+ CP_LengthList(5);
ChunkLength = Symbol_LengthList(5);
DataChunk = data((2.* ChunkStart)-1 : (2.*(ChunkStart+ChunkLength)-2));
DataChunkI = DataChunk(1:2:length(DataChunk));
DataChunkQ = DataChunk(2:2:length(DataChunk));
DataChunkComplex = DataChunkI + j*DataChunkQ;
DataChunkFFT = fftshift(fft(DataChunkComplex .* FrequencyShift'));
DataChunkFFT_RE = DataChunkFFT(107:107+(N_RE-1));
DataChunkFFT_IFFT = ifft(DataChunkFFT_RE);
DataChunkFFT_IFFT_Norm = DataChunkFFT_IFFT/max(abs(DataChunkFFT_IFFT));
subplot(7,6,[25 26]);
plot(abs(DataChunkFFT_IFFT_Norm));xlim([1, length(DataChunkFFT_IFFT_Norm)]); ylim([0 1.2]);
set(gca,'xticklabel',[]);set(gca,'yticklabel',[]);
set(gca,'xtick',[]);set(gca,'ytick',[]);
DataChunkFFT_RE = DataChunkFFT_RE ;
DataChunkFFT_IFFT = ifft(DataChunkFFT_RE);
DataChunkFFT_IFFT = DataChunkFFT_IFFT/max(abs(DataChunkFFT_IFFT));
DataChunkFFT_IFFT = DataChunkFFT_IFFT;
DataChunkFftMag = abs(DataChunkFFT_IFFT);
subplot(7,6,27);
plot(real(DataChunkFFT_IFFT),imag(DataChunkFFT_IFFT),'ro','MarkerFaceColor',[1 0 0],'MarkerSize',2);
xlim([-1 1]);ylim([-1 1]);
set(gca,'xticklabel',[]);set(gca,'yticklabel',[]);
set(gca,'xtick',[]);set(gca,'ytick',[]);
DataChunkFFT_RE = DataChunkFFT_RE .* EqFactor' ;
DataChunkFFT_IFFT = ifft(DataChunkFFT_RE);
DataChunkFFT_IFFT = DataChunkFFT_IFFT/max(abs(DataChunkFFT_IFFT));
DataChunkFFT_IFFT = DataChunkFFT_IFFT;
DataChunkFftMag = abs(DataChunkFFT_IFFT);
subplot(7,6,[28 29]);
plot(DataChunkFftMag);xlim([1, length(DataChunkFftMag)]); ylim([0 1.2]);
set(gca,'xticklabel',[]);set(gca,'yticklabel',[]);
set(gca,'xtick',[]);set(gca,'ytick',[]);
subplot(7,6,30);
DataChunkFFT_Comp = DataChunkFFT_IFFT;
DataChunkFFT_Comp = DataChunkFFT_Comp/max(abs(DataChunkFFT_Comp));
plot(real(DataChunkFFT_Comp),imag(DataChunkFFT_Comp),'ro','MarkerFaceColor',[1 0 0],'MarkerSize',2);
xlim([-1 1]);ylim([-1 1]);
set(gca,'xticklabel',[]);set(gca,'yticklabel',[]);
set(gca,'xtick',[]);set(gca,'ytick',[]);
%%%%%%%%%%%%%%%%%%%%%%%%%%%%%% Demodulation of symbol 5 %%%%%%%%%%%%%%%%%%%%%%%%%%%%%%%%%%%
% This is to demodulate the symbol 5 within the slot 0 of Subframe 0. Everything is same
% as in the symbol 0 analysis except the 'ChunkStart. So I would not explain any further.
ChunkStart = Offset ...
+ CP_LengthList(1) + Symbol_LengthList(1) ...
+ CP_LengthList(2) + Symbol_LengthList(2) ...
+ CP_LengthList(3) + Symbol_LengthList(3) ...
+ CP_LengthList(4) + Symbol_LengthList(4) ...
+ CP_LengthList(5) + Symbol_LengthList(5) ...
+ CP_LengthList(6);
ChunkLength = Symbol_LengthList(6);
DataChunk = data((2.* ChunkStart)-1 : (2.*(ChunkStart+ChunkLength)-2));
DataChunkI = DataChunk(1:2:length(DataChunk));
DataChunkQ = DataChunk(2:2:length(DataChunk));
DataChunkComplex = DataChunkI + j*DataChunkQ;
DataChunkFFT = fftshift(fft(DataChunkComplex .* FrequencyShift'));
DataChunkFFT_RE = DataChunkFFT(107:107+(N_RE-1));
DataChunkFFT_IFFT = ifft(DataChunkFFT_RE);
DataChunkFFT_IFFT_Norm = DataChunkFFT_IFFT/max(abs(DataChunkFFT_IFFT));
subplot(7,6,[31 32]);
plot(abs(DataChunkFFT_IFFT_Norm));xlim([1, length(DataChunkFFT_IFFT_Norm)]); ylim([0 1.2]);
set(gca,'xticklabel',[]);set(gca,'yticklabel',[]);
set(gca,'xtick',[]);set(gca,'ytick',[]);
DataChunkFFT_RE = DataChunkFFT_RE ;
DataChunkFFT_IFFT = ifft(DataChunkFFT_RE);
DataChunkFFT_IFFT = DataChunkFFT_IFFT/max(abs(DataChunkFFT_IFFT));
DataChunkFFT_IFFT = DataChunkFFT_IFFT;
DataChunkFftMag = abs(DataChunkFFT_IFFT);
subplot(7,6,33);
plot(real(DataChunkFFT_IFFT),imag(DataChunkFFT_IFFT),'ro','MarkerFaceColor',[1 0 0],'MarkerSize',2);
xlim([-1 1]);ylim([-1 1]);
set(gca,'xticklabel',[]);set(gca,'yticklabel',[]);
set(gca,'xtick',[]);set(gca,'ytick',[]);
DataChunkFFT_RE = DataChunkFFT_RE .* EqFactor' ;
DataChunkFFT_IFFT = ifft(DataChunkFFT_RE);
DataChunkFFT_IFFT = DataChunkFFT_IFFT/max(abs(DataChunkFFT_IFFT));
DataChunkFFT_IFFT = DataChunkFFT_IFFT;
DataChunkFftMag = abs(DataChunkFFT_IFFT);
subplot(7,6,[34 35]);
plot(DataChunkFftMag);xlim([1, length(DataChunkFftMag)]); ylim([0 1.2]);
set(gca,'xticklabel',[]);set(gca,'yticklabel',[]);
set(gca,'xtick',[]);set(gca,'ytick',[]);
subplot(7,6,36);
DataChunkFFT_Comp = DataChunkFFT_IFFT;
DataChunkFFT_Comp = DataChunkFFT_Comp/max(abs(DataChunkFFT_Comp));
plot(real(DataChunkFFT_Comp),imag(DataChunkFFT_Comp),'ro','MarkerFaceColor',[1 0 0],'MarkerSize',2);
xlim([-1 1]);ylim([-1 1]);
set(gca,'xticklabel',[]);set(gca,'yticklabel',[]);
set(gca,'xtick',[]);set(gca,'ytick',[]);
%%%%%%%%%%%%%%%%%%%%%%%%%%%%%% Demodulation of symbol 6 %%%%%%%%%%%%%%%%%%%%%%%%%%%%%%%%%%%
% This is to demodulate the symbol 6 within the slot 0 of Subframe 0. Everything is same
% as in the symbol 0 analysis except the 'ChunkStart. So I would not explain any further.
ChunkStart = Offset ...
+ CP_LengthList(1) + Symbol_LengthList(1) ...
+ CP_LengthList(2) + Symbol_LengthList(2) ...
+ CP_LengthList(3) + Symbol_LengthList(3) ...
+ CP_LengthList(4) + Symbol_LengthList(4) ...
+ CP_LengthList(5) + Symbol_LengthList(5) ...
+ CP_LengthList(6) + Symbol_LengthList(6) ...
+ CP_LengthList(7);
ChunkLength = Symbol_LengthList(7);
DataChunk = data((2.* ChunkStart)-1 : (2.*(ChunkStart+ChunkLength)-2));
DataChunkI = DataChunk(1:2:length(DataChunk));
DataChunkQ = DataChunk(2:2:length(DataChunk));
DataChunkComplex = DataChunkI + j*DataChunkQ;
DataChunkFFT = fftshift(fft(DataChunkComplex .* FrequencyShift'));
DataChunkFFT_RE = DataChunkFFT(107:107+(N_RE-1));
DataChunkFFT_IFFT = ifft(DataChunkFFT_RE);
DataChunkFFT_IFFT_Norm = DataChunkFFT_IFFT/max(abs(DataChunkFFT_IFFT));
subplot(7,6,[37 38]);
plot(abs(DataChunkFFT_IFFT_Norm));xlim([1, length(DataChunkFFT_IFFT_Norm)]); ylim([0 1.2]);
set(gca,'xticklabel',[]);set(gca,'yticklabel',[]);
set(gca,'xtick',[]);set(gca,'ytick',[]);
DataChunkFFT_RE = DataChunkFFT_RE ;
DataChunkFFT_IFFT = ifft(DataChunkFFT_RE);
DataChunkFFT_IFFT = DataChunkFFT_IFFT/max(abs(DataChunkFFT_IFFT));
DataChunkFFT_IFFT = DataChunkFFT_IFFT;
DataChunkFftMag = abs(DataChunkFFT_IFFT);
subplot(7,6,39);
plot(real(DataChunkFFT_IFFT),imag(DataChunkFFT_IFFT),'ro','MarkerFaceColor',[1 0 0],'MarkerSize',2);
xlim([-1 1]);ylim([-1 1]);
set(gca,'xticklabel',[]);set(gca,'yticklabel',[]);
set(gca,'xtick',[]);set(gca,'ytick',[]);
DataChunkFFT_RE = DataChunkFFT_RE .* EqFactor' ;
DataChunkFFT_IFFT = ifft(DataChunkFFT_RE);
DataChunkFFT_IFFT = DataChunkFFT_IFFT/max(abs(DataChunkFFT_IFFT));
DataChunkFFT_IFFT = DataChunkFFT_IFFT;
DataChunkFftMag = abs(DataChunkFFT_IFFT);
subplot(7,6,[40 41]);
plot(DataChunkFftMag);xlim([1, length(DataChunkFftMag)]); ylim([0 1.2]);
set(gca,'xticklabel',[]);set(gca,'yticklabel',[]);
set(gca,'xtick',[]);set(gca,'ytick',[]);
subplot(7,6,42);
DataChunkFFT_Comp = DataChunkFFT_IFFT;
DataChunkFFT_Comp = DataChunkFFT_Comp/max(abs(DataChunkFFT_Comp));
plot(real(DataChunkFFT_Comp),imag(DataChunkFFT_Comp),'ro','MarkerFaceColor',[1 0 0],'MarkerSize',2);
xlim([-1 1]);ylim([-1 1]);
set(gca,'xticklabel',[]);set(gca,'yticklabel',[]);
set(gca,'xtick',[]);set(gca,'ytick',[]);
The 1 RB DMRS is not a Zadoff-Chu sequence. Zadoff-Chu sequences start at 3 RB, and 1 RB and 2 RB use the base sequences of Table 5.5.1.2-1 and Table 5.5.1.2-2 instead. The comment for symbol 3 in the code is corrected to match. The rest of the code handles both kinds of sequence in the same way, because it uses only the 12 known values.
This code also uses fftshift, unlike the LTE UL (SC-FDMA) Demodulation page. The occupied bins then form one block, 107 to 118, instead of two blocks at the ends of the FFT output. FrequencyShift' still conjugates the shift, so the samples are shifted down by 7.5 kHz, as on that page.
DMRS first, data second : EqFactor comes from symbol 3 and applies to the whole slot.No IFFT for symbol 3 : the DMRS is not transform precoded.1 RB DMRS from Table 5.5.1.2-1 : Zadoff-Chu sequences start at 3 RB.fftshift keeps the RB in one block : bins 107 to 118.
How does the Equalization work ?
What does EqFactor actually hold, and why does the code multiply by EqFactor' rather than divide by it? The answer explains the two transposes that the code comments warn about.
EqFactor = DMRS_Inv .* transpose(DataChunkFFT_RE) is the received DMRS divided by the known DMRS. For each subcarrier, that ratio is the channel H, not its inverse. The code then multiplies each data subcarrier by EqFactor', which is the conjugate of H. So each data value Y = HX becomes |H|2X. The phase of the channel cancels, and only the real gain |H|2 is left.
That gain is almost the same on all 12 subcarriers here, because the DMRS row is flat. The code normalizes every symbol after the IFFT, so the constant gain disappears as well. When the gain changes across the subcarriers, dividing by H instead removes it exactly, and that is the zero-forcing form of the same equalizer.
The two transposes are therefore both intentional. The function transpose() keeps the received DMRS as it is, so EqFactor is H. EqFactor' conjugates H, and the conjugate is what removes the phase. Multiplying by H itself would double the phase error rather than remove it.
EqFactor is H : the received DMRS divided by the known DMRS.The data is multiplied by the conjugate of H : the phase cancels and |H|2 remains.Normalization removes the constant gain : the DMRS row shows that the gain is flat over the RB.Dividing by H is the zero-forcing form : it also corrects a gain that varies across subcarriers.
Reference
[1] 3GPP TS 36.211 v19.3.0 - clause 5.5.1 for the base sequences, clause 5.5.2.1 for the PUSCH DMRS, and clause 5.6 for SC-FDMA baseband signal generation
[2] LTE UL (SC-FDMA) Demodulation