3D Graph
In this page, I would post a quick reference for Matlab and Octave. (Octave is a GNU program which is designed to provide a free tool that work like Matlab. I don't think it has 100% compatability between Octave and Matlab, but I noticed that most of basic commands are compatible. I would try to list those commands that can work both with Matlab and Octave). All the sample code listed here, I tried with Octave, not with Matlab.
There are huge number of functions which has not been explained here, but I would try to list those functions which are most commonly used in most of matlab sample script you can get. My purpose is to provide you the set of basic commands with examples so that you can at least read the most of sample script you can get from here and there (e.g, internet) without overwhelming you. If you get familiar with these minimal set of functionality, you would get some 'feeling' about the tool and then you would make sense out of the official document from Mathworks or GNU Octave which explains all the functions but not so many examples.
I haven't completed 'what I think is the minimum set' yet and I hope I can complete within a couple of weeks. Stay tuned !!!
- plot3
- mesh
- surface
- contour
- scatter3
- surface in spherical coordinate
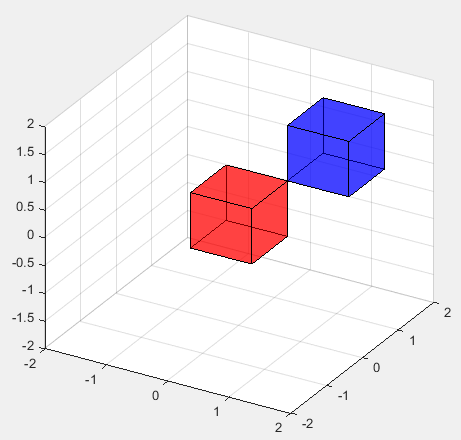
- patch : drawing a cube
- patch : drawing multiple cubes
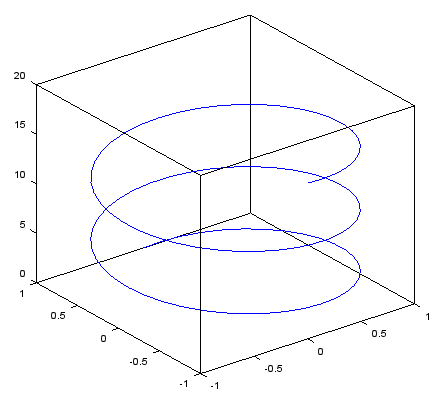
< plot3 - 3D Parametric Plot >
Ex)
|
Input |
t = linspace(0,5*pi,100); plot3(sin(t),cos(t),t) |
|
Output |
|
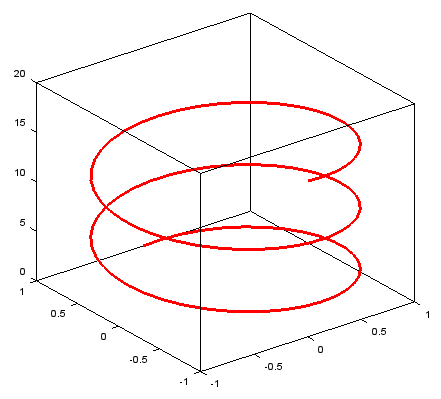
< plot3 - 3D Parametric Plot - linewidth, color>
Ex)
|
Input |
t = linspace(0,5*pi,100); plot3(sin(t),cos(t),t,'linewidth',3,'color','r'); |
|
Output |
|
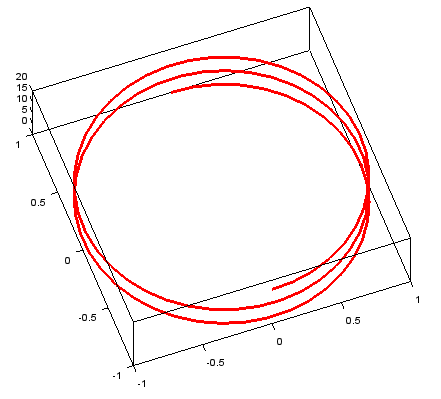
< plot3 - 3D Parametric Plot - view >
view(angle_around_z_axis, angle_around_y_axis) // angle in degree
Ex)
|
Input |
t = linspace(0,5*pi,100); plot3(sin(t),cos(t),t,'linewidth',3,'color','r'); view(-20,80); |
|
Output |
|
Ex)
|
Input |
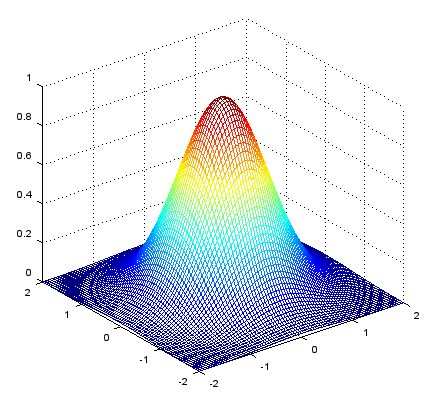
xstep = -2:.05:2; ystep = -2:.05:2; [X,Y] = meshgrid(xstep,ystep); Z = exp(-(X.^2+Y.^2)); mesh(X,Y,Z); |
|
Output |
|
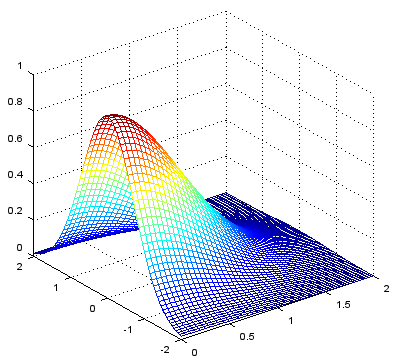
axis([xmin xmax ymin ymax zmin zmax])
Ex)
|
Input |
xstep = -2:.05:2; ystep = -2:.05:2; [X,Y] = meshgrid(xstep,ystep); Z = exp(-(X.^2+Y.^2)); mesh(X,Y,Z); axis([0 2 -2 2 0 1]); |
|
Output |
|
Ex)
|
Input |
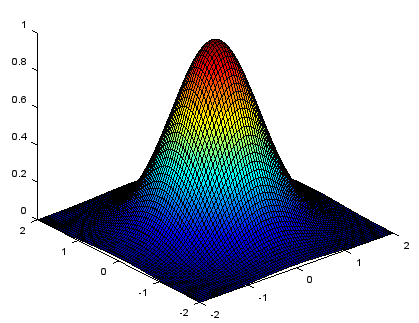
xstep = -2:.05:2; ystep = -2:.05:2; [X,Y] = meshgrid(xstep,ystep); Z = exp(-(X.^2+Y.^2)); surface(X,Y,Z); view(-40,30); |
|
Output |
|
Ex)
|
Input |
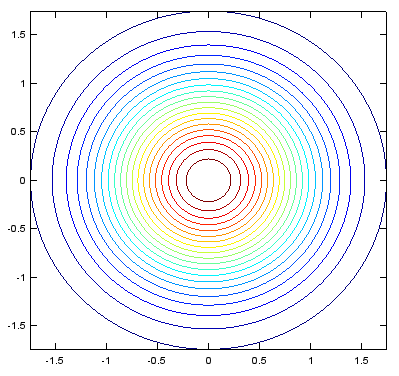
xstep = -2:.05:2; ystep = -2:.05:2; [X,Y] = meshgrid(xstep,ystep); Z = exp(-(X.^2+Y.^2)); contour(X,Y,Z,20); |
|
Output |
|
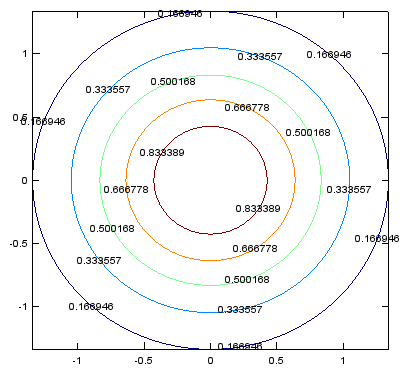
< contour - Labeling the level >
Ex)
|
Input |
xstep = -2:.05:2; ystep = -2:.05:2; [X,Y] = meshgrid(xstep,ystep); Z = exp(-(X.^2+Y.^2)); [c,h]=contour(X,Y,Z,5); clabel(c,h); |
|
Output |
|
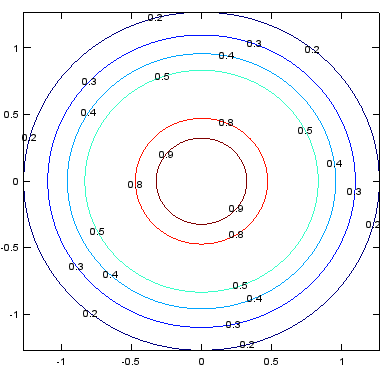
< contour - forcing contour lines >
Ex)
|
Input |
xstep = -2:.05:2; ystep = -2:.05:2; [X,Y] = meshgrid(xstep,ystep); Z = exp(-(X.^2+Y.^2)); [c,h]=contour(X,Y,Z,[0.0 0.2 0.3 0.4 0.5 0.8 0.9]); clabel(c,h); |
|
Output |
|
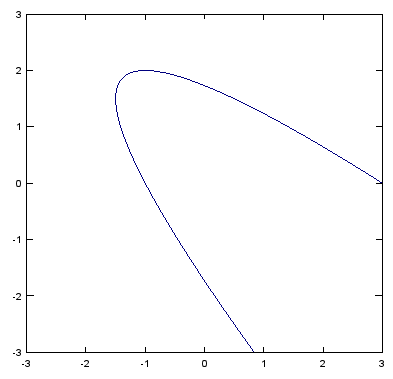
Ex)
|
Input |
xstep = -3:.05:3; ystep = -3:.05:3; [X,Y] = meshgrid(xstep,ystep); Z=X.^2 .+ 2.*X.*Y .+ Y.^2 - 2.*X; contour(X,Y,Z,[3,3]); % implicit plot for X.^2 .+ 2.*X.*Y .+ Y.^2 - 2.*X = 3 |
|
Output |
|
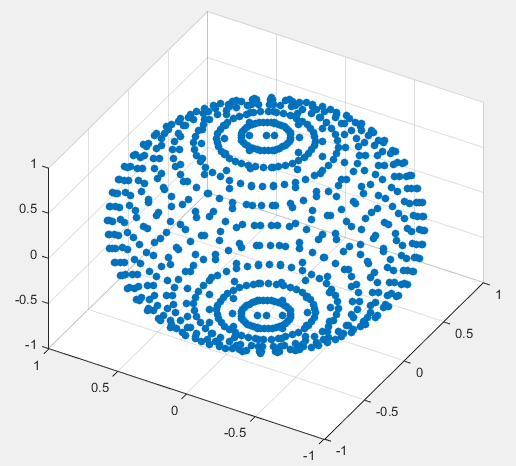
Ex) This has been tested only in Matlab (Not sure scatter3 is supported by Octave)
|
Input |
r = 1.0; x = []; y = []; z = [];
for azimuth = 0 : pi/20 : 2*pi for elevation = -pi/2 : pi/20 : pi/2; px= r .* cos(elevation) .* cos(azimuth); py = r .* cos(elevation) .* sin(azimuth); pz = r .* sin(elevation); x = [x px]; y = [y py]; z = [z pz]; end; end; scatter3(x,y,z,'filled'); view(-60,45); |
|
Output |
|
< surface in spherical coordinate >
Ex) This has been tested only in Matlab (Not sure scatter3 is supported by Octave)
|
Input |
r = 1.0; theta = 0 : pi/20 : 2*pi; phi = -pi/2 : pi/20 : pi/2;
[theta,phi] = meshgrid(theta,phi); [x,y,z] = sph2cart(theta,phi,r); surface(x,y,z);
view(-60,45); |
|
Output |
|
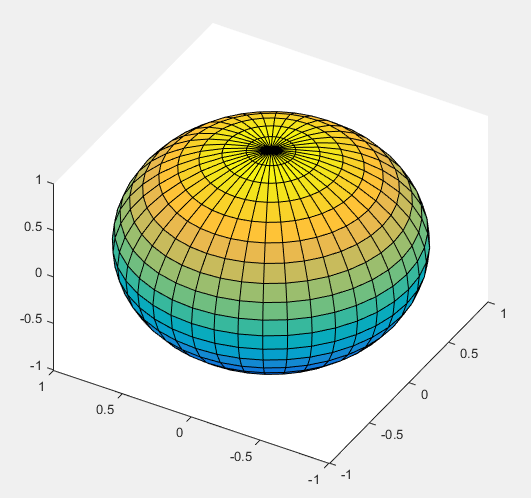
Ex) This has been tested only in Matlab (Not sure scatter3 is supported by Octave)
|
Input |
theta = linspace(0,2*pi,30); phi = linspace(-pi/2,pi/2,20);
[theta,phi] = meshgrid(theta,phi);
r = cos(phi);
[x,y,z] = sph2cart(theta,phi,r); surface(x,y,z);
view(-70,45); |
|
Output |
|
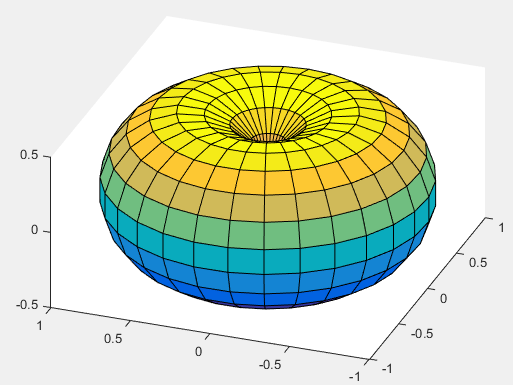
Ex) This has been tested only in Matlab (Not sure patch() is supported by Octave)
Note : If you copy and paste this code as it is, '...' may cause errors in Matlab. '...' erase this and retype '...' in your matlab code if you get errors.
|
Input |
% specifies all the vertices that comprises the object you want to draw vert = [-0.5 -0.5 -0.5; ... -0.5 0.5 -0.5; ... 0.5 0.5 -0.5; ... 0.5 -0.5 -0.5; ... -0.5 -0.5 0.5; ... -0.5 0.5 0.5; ... 0.5 0.5 0.5; ... 0.5 -0.5 0.5];
% define the arbitrary polygon(patch) using the vertice number(index) you defined above. fac = [1 2 3 4; ... 2 6 7 3; ... 4 3 7 8; ... 1 5 8 4; ... 1 2 6 5; ... 5 6 7 8];
% specify patch (polygons) in patch() function patch('Faces',fac,'Vertices',vert,'FaceColor','r'); % patch function axis([-2 2 -2 2 -2 2]); grid(); material shiny; alpha('color'); alphamap('rampdown'); view(30,30); |
|
Output |
|
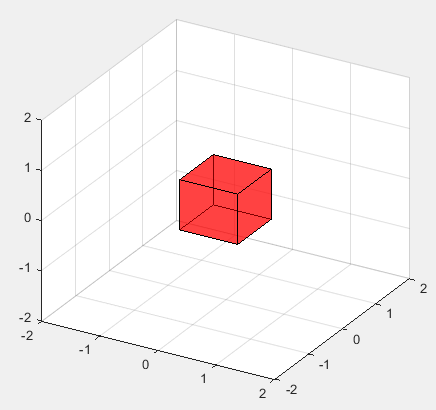
< patch : drawing multiple cubes >
Ex) This has been tested only in Matlab (Not sure patch() is supported by Octave)
Note : If you copy and paste this code as it is, '...' may cause errors in Matlab. '...' erase this and retype '...' in your matlab code if you get errors.
|
Input |
% specifies all the vertices that comprises the object you want to draw vert = [-0.5 -0.5 -0.5; ... -0.5 0.5 -0.5; ... 0.5 0.5 -0.5; ... 0.5 -0.5 -0.5; ... -0.5 -0.5 0.5; ... -0.5 0.5 0.5; ... 0.5 0.5 0.5; ... 0.5 -0.5 0.5];
% define the arbitrary polygon(patch) using the vertice number(index) you defined above. fac = [1 2 3 4; ... 2 6 7 3; ... 4 3 7 8; ... 1 5 8 4; ... 1 2 6 5; ... 5 6 7 8];
% specify patch (polygons) in patch() function % just call the patch function multiple times to draw multiple cubes patch('Faces',fac,'Vertices',vert,'FaceColor','r'); % draw the red cube patch('Faces',fac,'Vertices',(1+vert),'FaceColor','b'); % draw the blue cube axis([-2 2 -2 2 -2 2]); grid(); material shiny; alpha('color'); alphamap('rampdown'); view(30,30); |
|
Output |
|