RLC sits between PDCP and MAC. In AM, it runs its own ARQ loop on top of the HARQ in MAC. So the RLC configuration can change the throughput an application sees, even when the physical layer delivers the same transport blocks.
Let's first look at which RLC parameters RRC configures for a DRB, and what each one does to the data flow. Then we will compare RLC throughput and PHY throughput in a drive test log, and read the RLC configuration that was active during that test.
The page covers the following topics.
- Which RLC parameters are configured for a DRB ?
- Example 1 - PHY throughput and RLC Throughput in a drive test
- Reference
Which RLC parameters are configured for a DRB ?
Every DRB carries its own RLC configuration in drb-ToAddModList of RRCConnectionReconfiguration. The first choice is the RLC mode, UM or AM. The mode decides which of the other parameters exist at all, so let's compare the two modes before looking at single parameters.
The image below puts two DRB configurations side by side. The left one is a DRB in RLC UM with a bi-directional UM entity, and the right one is a DRB in RLC AM. Both use eps-BearerIdentity 5 and drb-Identity 1, so the differences sit only in pdcp-Config and rlc-Config.
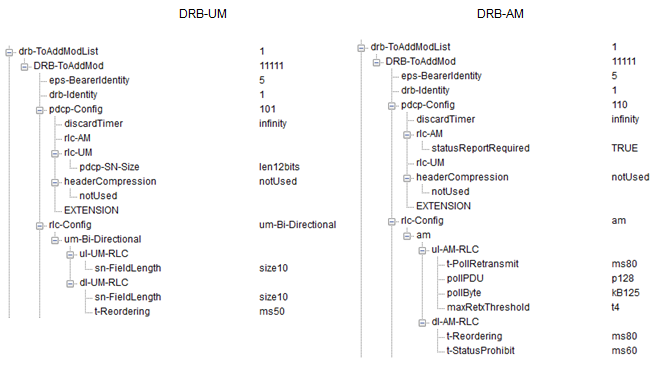
UM carries only the SN length and the reordering timer. AM adds the polling, retransmission and status timers that form its ARQ loop.
- DRB-UM : pdcp-Config carries pdcp-SN-Size len12bits. rlc-Config is um-Bi-Directional, with sn-FieldLength size10 in both ul-UM-RLC and dl-UM-RLC, and t-Reordering ms50 in dl-UM-RLC.
- DRB-AM : pdcp-Config carries rlc-AM with statusReportRequired TRUE. rlc-Config is am.
- ul-AM-RLC : t-PollRetransmit ms80, pollPDU p128, pollByte kB125 and maxRetxThreshold t4. These configure the transmitting side of the UE.
- dl-AM-RLC : t-Reordering ms80 and t-StatusProhibit ms60. These configure the receiving side of the UE.
Notice where each parameter lives. ul-AM-RLC holds the transmitter parameters of the UE, and dl-AM-RLC holds its receiver parameters. The eNB runs the DL transmitter with its own polling settings, and RRC does not signal them to the UE. So for a DL download test, the UE side of the ARQ loop is set only by t-Reordering and t-StatusProhibit.
The table below lists what each parameter does in TS 36.322 and how it can limit throughput. The value ranges are from TS 36.331 v19.3.0.
Parameter | Used by | What it does | How it can limit throughput |
sn-FieldLength | UM | 5 bit or 10 bit SN. UM_Window_Size is 16 or 512 | A 5 bit SN leaves only 16 PDUs in the reordering window |
AM SN length | AM | 10 bit SN, or 16 bit SN when ul/dl-extended-RLC-AM-SN-r13 is TRUE. AM_Window_Size is 512 or 32768 | The transmitter cannot send beyond VT(A) + AM_Window_Size, so a full window stalls until a STATUS PDU arrives |
pollPDU, pollByte | AM transmitter | Sets the poll bit after this many new PDUs or bytes | Rare polls delay the STATUS feedback that moves the window |
t-PollRetransmit | AM transmitter | Retransmits a poll when no STATUS PDU covers POLL_SN before expiry | A long value leaves a stalled window idle for longer |
maxRetxThreshold | AM transmitter | Limits the retransmissions of one AMD PDU. Reaching it is indicated to RRC | For MCG RLC, RRC treats it as radio link failure, so the data flow stops |
t-Reordering | UM and AM receiver | Waits for HARQ retransmissions before declaring a PDU lost | Too short causes false NACKs, and too long holds back delivery of later SDUs |
t-StatusProhibit | AM receiver | Minimum gap between two STATUS PDUs | A long value delays ACK and NACK, so the transmit window moves slowly |
Let's connect the table to a throughput test. HARQ in MAC recovers most transport block errors, and one HARQ round trip is 8 ms in FDD. RLC AM handles the residual errors, and its recovery takes at least one STATUS round trip. So in a healthy link, RLC mostly waits for HARQ, and t-Reordering sets how long it waits.
The window is the other limit. With the 10 bit SN, at most 512 AMD PDUs can be outstanding. If the STATUS feedback is late, for example because of a long t-StatusProhibit or rare polling, the transmitter reaches VT(MS) and stops sending new data. In that case the physical layer has capacity, but RLC has nothing it is allowed to send.
The value ranges have grown since Release 8. TS 36.331 v19.3.0 adds pollPDU-v1310 up to p16384 and PollByte-r14 up to kB40000. It also adds T-ReorderingExt-r17 with ms2200 and ms3200. The msX-v1310 values of t-PollRetransmit and t-StatusProhibit are configured only for a UE that supports CE.
The RLC mode decides the parameter set : UM has only the SN length and t-Reordering, while AM adds polling, retransmission and status timers.RRC signals only the receiver side of a DL AM entity to the UE : for a DL download, t-Reordering and t-StatusProhibit are the UE side of the ARQ loop.Window stall limits RLC AM throughput : late STATUS feedback stops new transmissions even when the physical layer has capacity.maxRetxThreshold ends in radio link failure : reaching it is not a throughput drop but a loss of the connection.
Example 1 - PHY throughput and RLC Throughput in a drive test
A drive test log shows whether RLC and PHY move together in a live network. The example below comes from a large file download. It puts RLC throughput, BLER and PHY throughput on the same time axis, so we can compare the three plots section by section.
Following plot is from the data captured by a drive test tool Azenqos Drive Test tool (AZQ Android) . I got the log captured by the tool and exported the data as csv file and then plot it on Microsoft Excel. This is a log captured from downloading a big file.
Just from this single capture, it is hard to understand how each of the RLC parameters influencing the final throughput. But I want to show you overall correlation between RLC throughput and Physical layer throughput.
Overall trend that you can easily notice and is easily understandable is
- There is high correlation between RLC throughput and PHY throughput
One thing I found strange (interesting) in this example is
- RLC throughput is generally higher than PHY throughput. This would be understandable if this is uplink throughput measured on UE, but it looks a little strange to me that this happens in downlink measured on UE. Probably, RLC buffering may affect the throughput measurement, but not sure.
One thing that may interest you (I am not saying this is abnormal.. just to let you see the plot in more detail)
- Comparing section (A) and (B), (A) throughput (peak throughput) is a little bit higher at PHY but become a little bit lower at RLC
- Comparing section (C) and (D), (C) throughput (peak throughput) is a little bit higher at PHY but become a little bit lower at RLC
- Section (E) shows much bigger difference between PHY throughput and RLC throughput.
- I think all of these differences are within normal variation, but if you see very large differences it would be something worth further investigation.
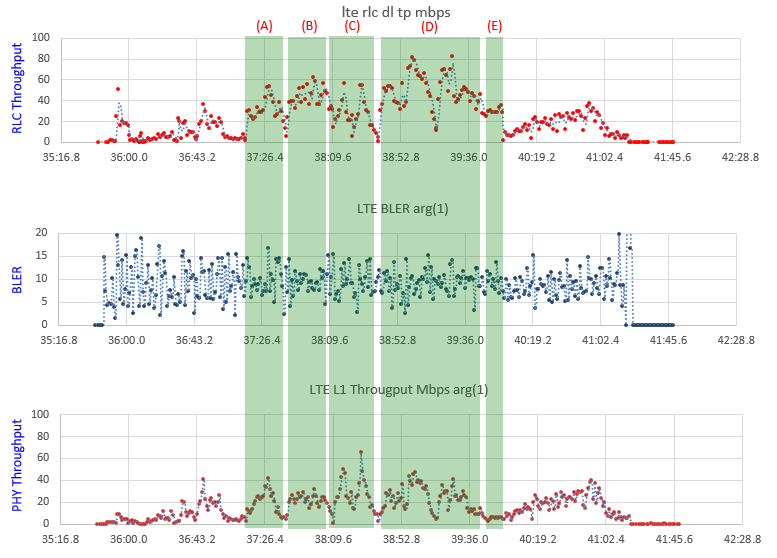
- Top panel : lte rlc dl tp mbps, the DL RLC throughput in Mbps. It peaks near 80 Mbps in section (D).
- Middle panel : LTE BLER arg(1), in percent. It stays mostly between about 5 and 15 through the whole log.
- Bottom panel : LTE L1 Througput Mbps arg(1), the PHY throughput in Mbps. Its highest point is about 65 Mbps in section (C).
- Green bands : sections (A) to (E), marked on all three panels at the same time positions.
The BLER plot does not change much between the sections. So the differences between sections (A) to (E) do not come from BLER, and the RLC plot follows the PHY plot in time.
Following is the RLC configuration that is configured in this test.
Decoded RRC message,
drb-ToAddModList: 1 item
     Item 0
         DRB-ToAddMod
             eps-BearerIdentity: 5
             drb-Identity: 1
             pdcp-Config
                 discardTimer: infinity (7)
                 rlc-AM
                     .... ...1 statusReportRequired: True
                 headerCompression: notUsed (0)
                     notUsed: NULL
             rlc-Config: am (0)
                 am
                     ul-AM-RLC
                         t-PollRetransmit: ms40 (7)
                         pollPDU: p32 (3)
                         pollByte: kB25 (0)
                         maxRetxThreshold: t32 (7)
                     dl-AM-RLC
                         t-Reordering: ms50 (10)
                         t-StatusProhibit: ms50 (10)
             logicalChannelIdentity: 3
             logicalChannelConfig
                 ul-SpecificParameters
                     priority: 11
                     prioritisedBitRate: kBps8 (1)
                     bucketSizeDuration: ms300 (3)
                     logicalChannelGroup: 3
Let's read this capture against the table in the previous section. The DRB runs RLC AM, and the capture shows no rlc-Config-v1310, so the entity uses the 10 bit SN and a window of 512 AMD PDUs. On the UE transmitter side, ul-AM-RLC polls every 32 PDUs or 25 kB and retransmits a poll after 40 ms. maxRetxThreshold t32 sets the RETX_COUNT at which the UE RLC tells RRC that the maximum number of retransmissions is reached.
For this DL download, dl-AM-RLC matters more. The UE waits 50 ms for HARQ before it treats a gap as a loss. After each STATUS PDU, the UE waits at least 50 ms before it sends the next one. Each enumerated value in the capture matches its index in TS 36.331 v19.3.0, for example t-Reordering ms50 is index 10.
Now back to the strange part, RLC throughput above PHY throughput. In DL, every RLC PDU reaches the UE inside a MAC transport block. So over a long download, the RLC data volume cannot be larger than the PHY data volume. The gap most likely comes from how the tool measures each value, and two things are worth checking.
The first is the averaging window. RLC reordering holds PDUs back while t-Reordering runs, and then delivers them in a burst. With a short window, the RLC value can stay above the PHY value for a while. The second is arg(1) in the PHY and BLER titles. If arg(1) selects one serving cell and the UE ran carrier aggregation, the PHY plot shows one carrier while RLC counts all of them.
RLC throughput follows PHY throughput : peaks and dips in the two plots line up in time, because RLC can deliver only what the transport blocks carry.A long-term RLC rate above the PHY rate points to the measurement : check the averaging window and the carrier that the PHY counter covers before looking for a protocol cause.The capture explains only the UE side of the DL ARQ loop : the DL polling settings of the eNB are not in the RRC message.BLER alone does not explain the section differences : BLER stays in the same range in sections (A) to (E).