|
Data Throughput |
||
|
Drive Test
We are doing various kinds of throughput related test in the lab, but the most meaningful test is to test in the field like downloading / uploading files in out doors sometimes walking along the street or in driving because those are most closes related to real user experience. In the field / drive test, you can get various kind of performance data. I had an existing note on drive test in terms of various performance indicators explained in this note for LTE and this note in NR . In this note, I want to share some experience field test with focus on throughput performance. Since I don't have any first hand experience on the field test, I relied mostly on a few contributors for the data for each of the notes. The data shared in this note is contributed by Ali Khalid who kindly allowed me to share his data and documents and clarified on many things in email communications.
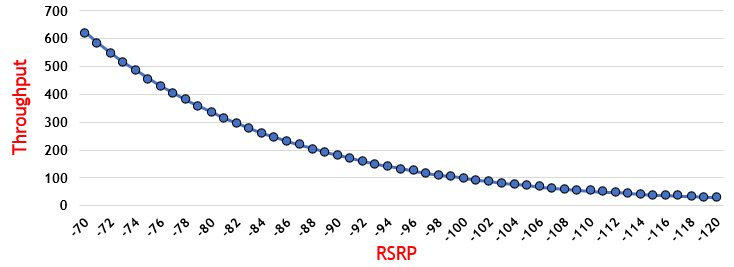
Intuitively (or based on engineering common sense) everybody would understand we would have less throughput as RSRP goes poorer. This is confirmed by real measurement data as shown here. However, you may not get this kind of clear / textbook like data from single UE driving closer and farther away from a cell or single snapshots from multiple UEs located closer and farther from a single cell site. You may need to collect data from multiple measurement and do averaging, removing outliers etc.
Even though it would be common sense to get lower throughput as RSRP goes poorer, the exact rate of throughput decrease vs rsrp decrease (i.e, the slope of tangential line at each point on the curve) may vary depending on each specific UEs since those can be affected by UE reciever chain / channel decoder performance.
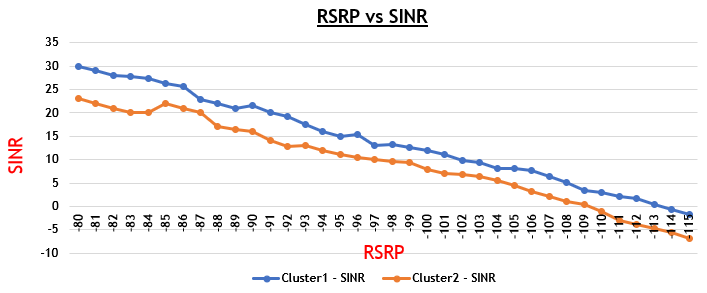
Another factor affecting the throughput is SINR. As in RSRP, throughput gets lower as SINR gets poorer (lower) as shown below. This plot is also based on some statistical cleaning on the data. If you are getting the data from a single UE and plot it as it is, it would look something like this.
In previous section, we observed on the correlation between throughput and RSRP, but RSRP is not the direct factor affecting the throughput. A direct factor affecting the throughput is actually the SINR. The reason why RSRP seems to affect throughput is due to the correlation between RSRP and SINR. As shown in the plot below, SINR goes poorer (lower) as RSRP gets poorer (lower) and throughput gets lower as SINR goes poorer. The rate of throughput degradation as per SINR degradation would vary depending on UE and this can be an indicator of the UE's RX chain performance.
SINR is an indicator affected by both SNR and Interference. So RSRP for the same SINR may vary depending on the existence of interferrer. This situation is also shown in the above plot. As you see here, with the same RSRP you see the different SINR between cluster 1 and cluster 2. At every RSRP in the plot, SINR measured in cluster 1 shows better SINR (higher SINR) than in cluster 2. Since SINR is direct factor affecting the throughput, you would get better throughput in cluster 1 at the same RSRP.
NOTE : The term cluster used in this test is a group of neighbouring cells which may act as interferer to each other.
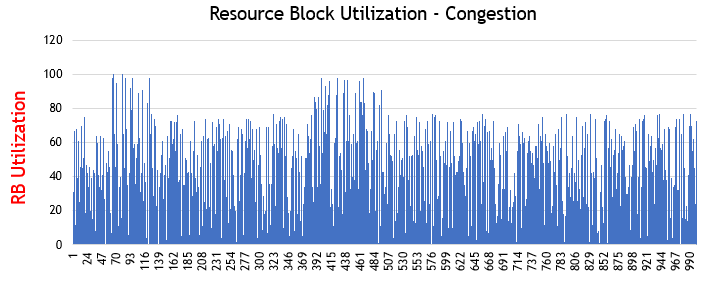
Now let's assume that you are getting the throughput lower than expected and want to figure out some root cause of the poor throughput. The first question you might have would be 'would this be a capacity issue or congestion problem ?'. One easy and quick indicator would be to check RB utilization. Followings are two plots shows the RB utilization (i.e, how many RBs are allocated to the UE at certain time).
At first plot, you would notice that the number assigned RBs are fluctuating greately and average number of RBs are relatively low (NOTE : this is from LTE UE with 20Mhz Channel BW, so the ideal max of RB allocation is 100). This would imply that Network has difficulties in allocating the constant and large number of RBs across all time mainly because there are bunch of other UEs needed to be scheduled at the same time. This kind of situgation is called 'Congestion'.
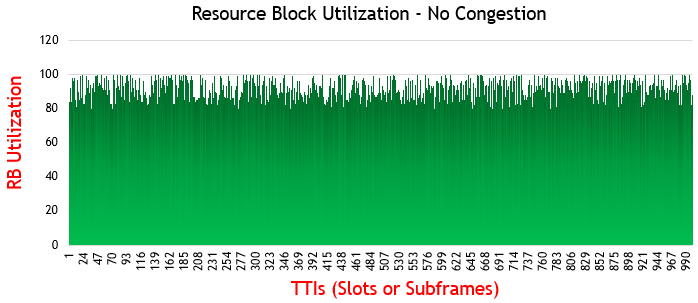
On the contrary, suppose you see RB allocation as shown below. In this plot, you would see the average number of RBs are relatively high and the fluctuation of the number of RBs are not wide. This implies that Network can allocate almost max number of RB for this UE whenever it needs. This in turn would imply that there are not much of competing UEs requesting RB allocation.
What if you still have lower throughput even when you have high RB utilization ? Some possible root cause popping up my mind would be lower MCS due to poor radio link quality or data push from the core network itself is low. I would personally check on MCS allocation first in this case as in this note.
The issues described in previous sections are mostly related to RAN side issue or the issue of air interface between RAN and UE. But there would be cases where you have less throughput than expected even when there is no problem with RAN or air interface. There might be cases where throughput is throttled by the data path outside of RAN towards core network (Backhaul).
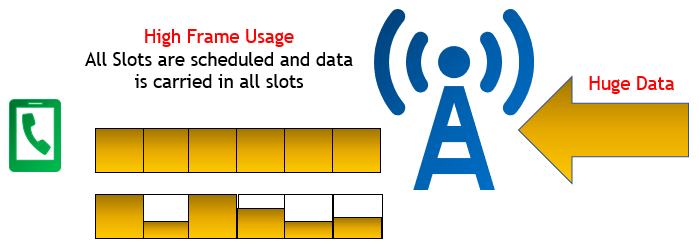
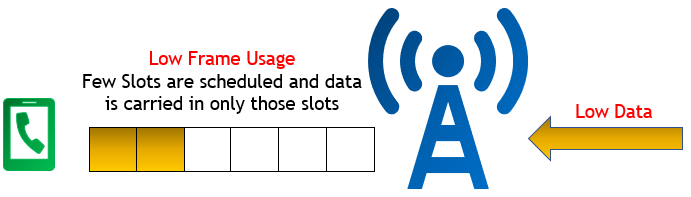
Slot utilization can be an indicator showing whether the throughput is throttled by Backhaul or not. In short, you will see high slot utilization when there is no problem with Backhaul and see lower slot utilization when the throughput is throttled by backhaul (NOTE : In this case, you are downloading large enough data that requires high slot utilzation. If you are downloading small amount of data, lower slot utilization would not directly indicating that backhaul is throttling the throughput).
In the illustration shown below, you would notice all slots are scheduled indicating that higher layer data is continously flowing into RAN and backhaul may not be throttling data flow.
In the illustration shown below, you would notice only are few slots are scheduled indicating that the amount of data flowing into RAN is small and bursty. If you see this pattern even when you are trying to download large amount of data, it is highly likely that the throughput is throttled by Backhaul.
Reference :
|
||