Even before you try any throughput test (e.g, UDP, TCP), there are several critical steps to go through. In many cases, I had been asked to be on-site saying "SOMETHING is NOT WORKING" (These two words are what we most frequently use, but most ambiguous word. What is the "SOMETHING" ? What do you mean by "NOT WORKING". .. Let'snot get into this too much -:).
Followings are some of the items that I recommend you to try before you starting throughput test. I call this as 'Connection Test' or 'Data Path Check'.
The checks below follow the data path from the inside out. First you confirm that the UE has an IP address. Then you ping in steps, from the PC itself, to the wireline network, and finally over the radio link to the server. Each step gives you a reference delay, so a bad number on the radio link stands out against the wireline numbers.
- Check IP Allocation
- Try Ping and Ping Delay
- Ping to Local IP - Ping to itself
- Ping to Gateway - Wireline
- Ping to Distant Server - Wireline
- Ping to Server PC - WCDMA DL 384K / UL 64 K - Test Equipment
- Ping to Server PC - HSDPA DL 7.2 M/UL 5.6 M - Test Equipment
- Ping to Server PC - HSDPA DL 14.4 M/UL 5.6 M - Test Equipment
- Ping to Server PC - HSDPA 64QAM/Single Carrier - Test Equipment
- Ping to Server PC - HSDPA 64QAM/Dual Carrier - Test Equipment
- Ping from Server PC to UE - LTE - Test Equipment
- More to think of
- Why does the ping delay change with the radio technology ?
- Reference
Check IP Allocation
First thing you have to check is to check if your device get assigned any IP address that a network or Network Emulator assigned. If you have UE logging tool or special menu/tool on your UE to show the IP address, it will be great help.
Another way to check the IP allocation for UE if the UE is a data card or connected to PC as a modem (tethered to PC), try ipconfig command as follows.
Capture : ipconfig output on the UE PC with the data card connected. The lines come from one recorded session, so they are shown as they were printed.
C:\> ipconfig
Ethernet adapter Local Area Connection 9:
        Connection-specific DNS Suffix  . :
        IP Address. . . . . . . . . . . . : 192.168.1.1
        Subnet Mask . . . . . . . . . . . : 255.255.255.0
        Default Gateway . . . . . . . . . :
In some case, this result (i.e, ipcofig shows the IP address allocated to UE) is enough signal for you to go to next step like ping. But sometimes just ipconfig result would not be a guarantee for next step. (I think it depends on UE driver implementation).
A better insurance in this case would be as follows. Open up the Network Connection Menu and see if you see the Modem and Network interface card properly configured and connected.
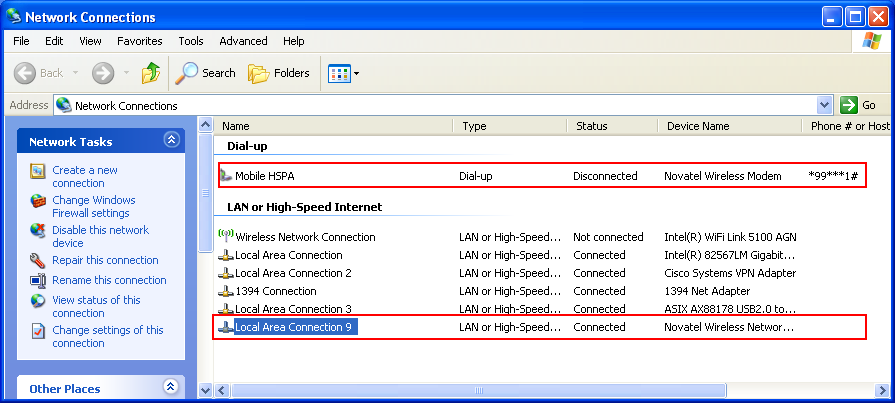
In the Network Connections window above, the same Novatel card appears twice. The Dial-up entry Mobile HSPA is the modem side of the card, and it is Disconnected. The LAN entry Local Area Connection 9 is the network adapter side of the card, and it is Connected. So in this test the card works as a network card, not as a dial-up modem. Local Area Connection 9 is also the adapter name in the ipconfig capture above.
And openup the LAN card property for the UE and set the IP allocated to UE.
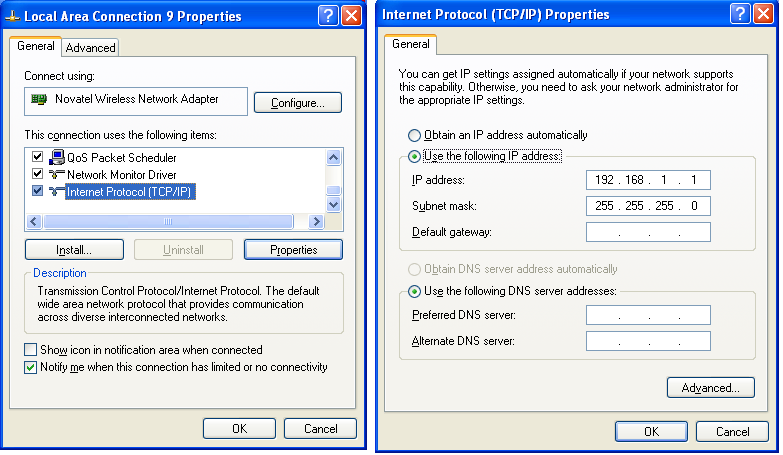
In the two property dialogs above, the Internet Protocol of the Novatel Wireless Network Adapter is set by hand. The IP address is 192.168.1.1 and the subnet mask is 255.255.255.0, and the default gateway is empty. These are the same values that ipconfig printed. The address must match the address that the network or the Network Emulator gave to the UE. Otherwise the PC sends packets that the network does not route back.
Now you are ready to take real first step for the test, which is PING test. I am using Ping for two purpose. One is to check if the end to end (from server to client) data path is established and the other is to figure out the latency (delay time) between server and client.
An IP address on the PC is not the whole check : the adapter must also show Connected, and its address must match the one the network assigned.Know which adapter carries the test : a data card can appear as a dial-up modem and as a network card, and only one of them is in use.Check the default gateway : the UE adapter in this test has none, so traffic to another subnet leaves through another adapter of the PC.
Try Ping and Ping Delay
First I would do "ping to self". In my test, I allocated 192.168.1.1 to UE and 192.168.1.2 to server. All of these test was done on client PC, the PC to which the UE is connected.
Ping to Local IP - Ping to itself
This would always works.. but I did to give you some reference for latency for local loop. It is under 1 ms as you see. The local loop never leaves the PC, so it measures only the IP stack of the client PC. Use it as the zero point for every delay below.
Capture : ping to the local IP on the client PC. The lines come from one recorded session, so they are shown as they were printed.
C:\>ping 192.168.1.1 -l 1400 (WCDMA DL 384K / 64 K, Local Loopback)

Pinging 192.168.1.1 with 1400 bytes of data:

Reply from 192.168.1.1: bytes=1400 time<1ms TTL=128
Reply from 192.168.1.1: bytes=1400 time<1ms TTL=128
Reply from 192.168.1.1: bytes=1400 time<1ms TTL=128
Reply from 192.168.1.1: bytes=1400 time<1ms TTL=128

Ping statistics for 192.168.1.1:
    Packets: Sent = 4, Received = 4, Lost = 0 (0% loss),
Approximate round trip times in milli-seconds:
    Minimum = 0ms, Maximum = 0ms, Average = 0ms
Ping to Gateway - Wireline
For another reference, I ping to the Gateway my PC is connected to via wireline LAN. In my case, it shows almost same latency as local loop.
Capture : ping to the wireline gateway. The lines come from one recorded session, so they are shown as they were printed.
C:\>ping 10.10.10.180 (on Wireline, to Gateway)

Pinging 10.10.10.180 with 32 bytes of data:

Reply from 10.10.10.180: bytes=32 time<1ms TTL=128
Reply from 10.10.10.180: bytes=32 time<1ms TTL=128
Reply from 10.10.10.180: bytes=32 time<1ms TTL=128
Reply from 10.10.10.180: bytes=32 time<1ms TTL=128

Ping statistics for 10.10.10.180:
    Packets: Sent = 4, Received = 4, Lost = 0 (0% loss),
Approximate round trip times in milli-seconds:
    Minimum = 0ms, Maximum = 0ms, Average = 0ms
Ping to Distant Server - Wireline
Now for another reference, I pigned to a server which is far away from my PC. I don't know how many routers are there between my PC and the other PC. I don't know how far it is away from my PC geographically. Anyway the result is as follows. Now you see pretty long response delay here which is around 220 ms.
Capture : ping to a distant server over the wireline network. The lines come from one recorded session, so they are shown as they were printed.
C:\>ping 64.233.183.99 (on Wireline)

Pinging 64.233.183.99 with 32 bytes of data:

Reply from 64.233.183.99: bytes=32 time=222ms TTL=43
Reply from 64.233.183.99: bytes=32 time=221ms TTL=43
Reply from 64.233.183.99: bytes=32 time=221ms TTL=43
Reply from 64.233.183.99: bytes=32 time=222ms TTL=43

Ping statistics for 64.233.183.99:
    Packets: Sent = 4, Received = 4, Lost = 0 (0% loss),
Approximate round trip times in milli-seconds:
    Minimum = 221ms, Maximum = 222ms, Average = 221ms
Ping to Server PC - WCDMA DL 384K / UL 64 K - Test Equipment
Now let's get into the situation that we are really interested. I connected UE to my Network Emulator with WCDMA DL 384K /UL 64 K radio bearer and got the following result. If you try with your device, you may have different number.. so the exact number for the time delay would not be so important, but you see pretty long delay which is around 323 ms. I put "-l" optionto send almost full size IP packet. It is direct connection from UE to Network emulator. But if you see the delay value here, it is greater than the delay between my PC and a remote server on wireline network which may have over 100 hops along the line.
Capture : ping to the Server PC over a WCDMA DL 384K / UL 64K bearer. The lines come from one recorded session, so they are shown as they were printed.
C:\>ping 192.168.1.2 -l 1400 (WCDMA DL 384K / UL 64 K)

Pinging 192.168.1.2 with 1400 bytes of data:

Reply from 192.168.1.2: bytes=1400 time=332ms TTL=128
Reply from 192.168.1.2: bytes=1400 time=326ms TTL=128
Reply from 192.168.1.2: bytes=1400 time=324ms TTL=128
Reply from 192.168.1.2: bytes=1400 time=323ms TTL=128

Ping statistics for 192.168.1.2:
    Packets: Sent = 4, Received = 4, Lost = 0 (0% loss),
Approximate round trip times in milli-seconds:
    Minimum = 323ms, Maximum = 332ms, Average = 326ms
I used exactly same UE and same driver. Only changed radio bearer to HSDPA DL 3.6 M/UL 5.6 M. Pinged and got the result as follows. Delay time decreased almost 3 times.
Capture : ping to the Server PC over an HSDPA DL 3.6 M / UL 5.6 M bearer. The lines come from one recorded session, so they are shown as they were printed.
C:\>ping 192.168.1.2 -l 1400   (HSDPA DL 3.6 M/UL 5.6 M)

Pinging 192.168.1.2 with 1400 bytes of data:

Reply from 192.168.1.2: bytes=1400 time=112ms TTL=128
Reply from 192.168.1.2: bytes=1400 time=107ms TTL=128
Reply from 192.168.1.2: bytes=1400 time=116ms TTL=128
Reply from 192.168.1.2: bytes=1400 time=115ms TTL=128

Ping statistics for 192.168.1.2:
    Packets: Sent = 4, Received = 4, Lost = 0 (0% loss),
Approximate round trip times in milli-seconds:
    Minimum = 107ms, Maximum = 116ms, Average = 112ms
Ping to Server PC - HSDPA DL 7.2 M/UL 5.6 M - Test Equipment
And tried the ping with a little bit higher data rate HSPA Bearer (HSDPA DL 7.2 M/UL 5.6 M). It is almost same delay time as before (lower data rate HSPA). Definately you will see different throughput comparing to previous bearer, but in terms of ping delay we don't see much difference here.
Capture : ping to the Server PC over an HSDPA DL 7.2 M / UL 5.6 M bearer. The lines come from one recorded session, so they are shown as they were printed.
C:\>ping 192.168.1.2 -l 1400  (HSDPA DL 7.2 M/UL 5.6 M)

Pinging 192.168.1.2 with 1400 bytes of data:

Reply from 192.168.1.2: bytes=1400 time=116ms TTL=128
Reply from 192.168.1.2: bytes=1400 time=111ms TTL=128
Reply from 192.168.1.2: bytes=1400 time=110ms TTL=128
Reply from 192.168.1.2: bytes=1400 time=108ms TTL=128

Ping statistics for 192.168.1.2:
    Packets: Sent = 4, Received = 4, Lost = 0 (0% loss),
Approximate round trip times in milli-seconds:
    Minimum = 108ms, Maximum = 116ms, Average = 111ms
Ping to Server PC - HSDPA DL 14.4 M/UL 5.6 M - Test Equipment
From previous two test, I don't depect any big different with this test, but anyway I gave it another try with higher HSDPA bearer. The result confirms the pattern. The average stays at about 115 ms, so the HSDPA bit rate is no longer what sets the delay.
Capture : ping to the Server PC over an HSDPA DL 14.4 M / UL 5.6 M bearer. The lines come from one recorded session, so they are shown as they were printed.
C:\>ping 192.168.1.2 -l 1400  (HSDPA DL 14.4 M/UL 5.6 M)

Pinging 192.168.1.2 with 1400 bytes of data:

Reply from 192.168.1.2: bytes=1400 time=126ms TTL=128
Reply from 192.168.1.2: bytes=1400 time=113ms TTL=128
Reply from 192.168.1.2: bytes=1400 time=112ms TTL=128
Reply from 192.168.1.2: bytes=1400 time=110ms TTL=128

Ping statistics for 192.168.1.2:
    Packets: Sent = 4, Received = 4, Lost = 0 (0% loss),
Approximate round trip times in milli-seconds:
    Minimum = 110ms, Maximum = 126ms, Average = 115ms
Ping to Server PC - HSDPA 64QAM/Single Carrier - Test Equipment
Now I pushed the same device one more step upward. I get it connected to HSPA+ Bearer (Category 14, 64 QAM). You see the difference ? The delay time get halved comparing to conventional HSDPA.
Look at the capture below carefully. The command line asks for 1400 bytes with -l 1400, but the replies show 32 bytes. So the delays in this capture belong to a 32 byte ping. The same mismatch appears in the dual carrier capture that follows.
Capture : ping to the Server PC over an HSPA+ 64QAM single carrier bearer. The lines come from one recorded session, so they are shown as they were printed.
C:\>ping 192.168.1.2  -l 1400 (HSPA 64 QAM / Single Carrier)

Pinging 192.168.1.2 with 32 bytes of data:

Reply from 192.168.1.2: bytes=32 time=58ms TTL=128
Reply from 192.168.1.2: bytes=32 time=54ms TTL=128
Reply from 192.168.1.2: bytes=32 time=53ms TTL=128
Reply from 192.168.1.2: bytes=32 time=52ms TTL=128

Ping statistics for 192.168.1.2:
    Packets: Sent = 4, Received = 4, Lost = 0 (0% loss),
Approximate round trip times in milli-seconds:
    Minimum = 52ms, Maximum = 58ms, Average = 54ms
Ping to Server PC - HSDPA 64QAM/Dual Carrier - Test Equipment
Now I upgraded the bearer one step further to HSPA+ Dual Carrier (Category 24) and I don't see much improvement comparing to previous one. The average of 51 ms is close to the 54 ms of the single carrier case. A second carrier adds bandwidth, but it does not shorten the TTI or the scheduling steps.
Capture : ping to the Server PC over an HSPA+ dual carrier bearer. The lines come from one recorded session, so they are shown as they were printed.
C:\>ping 192.168.1.2 -l 1400 (HSPA+ Dual Carrier)

Pinging 192.168.1.2 with 32 bytes of data:

Reply from 192.168.1.2: bytes=32 time=53ms TTL=128
Reply from 192.168.1.2: bytes=32 time=48ms TTL=128
Reply from 192.168.1.2: bytes=32 time=47ms TTL=128
Reply from 192.168.1.2: bytes=32 time=56ms TTL=128

Ping statistics for 192.168.1.2:
    Packets: Sent = 4, Received = 4, Lost = 0 (0% loss),
Approximate round trip times in milli-seconds:
    Minimum = 47ms, Maximum = 56ms, Average = 51ms
Ping from Server PC to UE - LTE - Test Equipment
Now let's try with the LTE. I setup a EPS Bearer in Test Equipment (Network Simulator) and get UE connected to it with EPS Bearer which is large enough to transmit the whole ping package in a single PDSCH / PUSCH.
First tried with a large ping packet size, I got following result. Here, you see about 14 ms turn around time.. but for some UE I get 11 ms turnaround time.
Capture : ping from the Server PC to the UE over LTE with 1400 byte packets. The lines come from one recorded session, so they are shown as they were printed.
C:\>ping 192.168.1.1 -l 1400

Pinging 192.168.1.1 with 1400 bytes of data:
Reply from 192.168.1.1: bytes=1400 time=15ms TTL=64
Reply from 192.168.1.1: bytes=1400 time=14ms TTL=64
Reply from 192.168.1.1: bytes=1400 time=15ms TTL=64
Reply from 192.168.1.1: bytes=1400 time=15ms TTL=64

Ping statistics for 192.168.1.1:
    Packets: Sent = 4, Received = 4, Lost = 0 (0% loss),
Approximate round trip times in milli-seconds:
    Minimum = 14ms, Maximum = 15ms, Average = 14ms
Then I tried with smaller packet size (default ping packet size) and I tend to get a little bit short turnaround time but not so different.
Capture : ping from the Server PC to the UE over LTE with the default packet size. The lines come from one recorded session, so they are shown as they were printed.
C:\>ping 192.168.1.1

Pinging 192.168.1.1 with 32 bytes of data:
Reply from 192.168.1.1: bytes=32 time=16ms TTL=64
Reply from 192.168.1.1: bytes=32 time=13ms TTL=64
Reply from 192.168.1.1: bytes=32 time=11ms TTL=64
Reply from 192.168.1.1: bytes=32 time=12ms TTL=64

Ping statistics for 192.168.1.1:
    Packets: Sent = 4, Received = 4, Lost = 0 (0% loss),
Approximate round trip times in milli-seconds:
    Minimum = 11ms, Maximum = 16ms, Average = 13ms
More to think of
Now let's get into each of different radio technologies and see if we can explain why we have different throughput and even different ping delay.
I haven't completed the remaining part... but it would be good to give all of you a couple of days to think about this issue.
- What kind of failure mode you see for each technology ? (Data rate lower than you expected ? Data rate no problem.. but all of the sudden call drop ? )
- The failure mode is same for all technology or different ?
- Recalling each of the steps along the data path, which one do you think would be the bottleneck for the throughput ?
- Would the bottleneck be the same for all technology ? or different ?
- Can you explain technically about the root cause of the failure ?
Don't expect that I would know all the answer and give you the clear answer. I also have to think a lot and will give you my opinion just based on my experience and based on my shallow knowledge a couple of days later.
For the first two questions, the shape of the throughput graph is a useful first hint. A rate that stays steady but low usually points at a capacity limit somewhere in the path, such as the bearer, a USB link or a PC. A rate that starts well and then collapses usually points at buffer overflow or retransmission. A call drop is different again. It points at the radio link or at RRC, not at the IP path, so the UE log is the place to look.
The next section answers the delay part of these questions from the captures on this page. The throughput part needs the layer by layer view of the data path, which the other throughput pages of this site cover. When you think about the bottleneck, keep two numbers apart. One is the bit rate of the slowest link. The other is the fixed time that each link adds to every packet, whatever its size.
Why does the ping delay change with the radio technology ?
The captures above show a clear pattern. The average delay is 326 ms on WCDMA DL 384K / UL 64K, 111 to 115 ms on HSDPA, 51 to 54 ms on HSPA+, and 13 to 14 ms on LTE. Let's look at what sets each number. Two things dominate. The first is the time to push the packet through the slowest link. The second is the transmission time interval, or TTI, and the scheduling steps of the radio link.
Start with WCDMA. A ping with -l 1400 carries 1400 bytes of data, 8 bytes of ICMP header and 20 bytes of IP header. That is 1428 bytes, or 11424 bits. At 64 kbps, the uplink alone needs about 178 ms to send it. At 384 kbps, the downlink needs about 30 ms for the reply. So about 208 ms of the 326 ms is the bit rate of the bearer, before any other delay. This is why the radio link looks slower than a distant server with many hops.
With HSPA, the same packet takes only a few milliseconds at 3.6 Mbps in the downlink and 5.6 Mbps in the uplink. So the bit rate no longer dominates, and changing the HSDPA rate from 3.6 M to 14.4 M changes the delay very little. What remains is the TTI, the scheduling and the processing in the UE and the equipment. TS 25.212 fixes the TTI of HS-DSCH at 2 ms, and sets the TTI of E-DCH to 2 ms or 10 ms. A DCH uses a TTI of 10, 20, 40 or 80 ms. The captures do not show which E-DCH TTI the bearers used, so they cannot tell you how much of the drop from 111 ms to 54 ms comes from the TTI.
LTE shortens every step. The LTE TTI is one subframe, which is 1 ms long. For FDD, the UE sends PUSCH 4 subframes after the uplink grant, as TS 36.213 clause 8.0 specifies. In the LTE capture, the Server PC starts the ping. So the downlink request goes out on PDSCH first. The UE then needs an uplink grant for the reply, which usually means a scheduling request, a grant and the PUSCH four subframes later. A round trip of 11 to 16 ms fits that chain. The exact value depends on the scheduling request period and on the scheduler of the equipment.
A slow bearer makes the delay long : on WCDMA DL 384K / UL 64K, sending one 1428 byte packet takes more than half of the measured round trip.After HSPA, the bit rate stops mattering for ping : the TTI and the scheduling steps set the delay, so a higher HSDPA rate changes little.LTE is fast because each step is short : a 1 ms TTI and a fixed 4 subframe gap from uplink grant to PUSCH keep the chain near 10 ms.Read the capture header : two HSPA+ captures show 32 byte replies although the command line asks for 1400 bytes.
Reference
[1] 3GPP TS 25.212 v19.0.0 - Multiplexing and channel coding, FDD, clause 4.2 transmission time intervals of DCH, HS-DSCH and E-DCH
[2] 3GPP TS 36.213 v19.4.0 - E-UTRA, Physical layer procedures, clause 8.0 UE procedure for transmitting the physical uplink shared channel