Web Simulation 


Transformer Q, K, V Attention Tutorial 

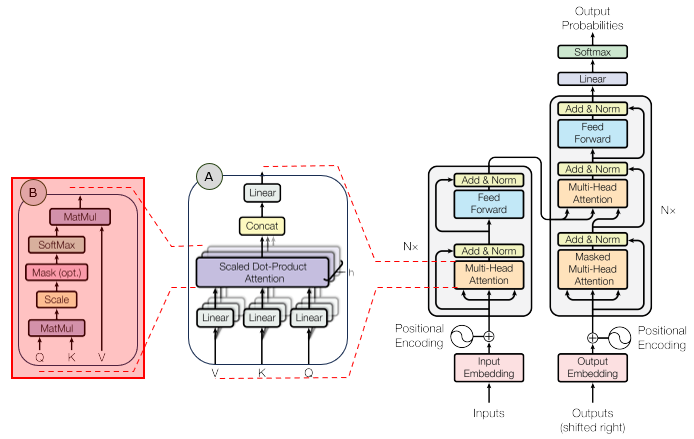
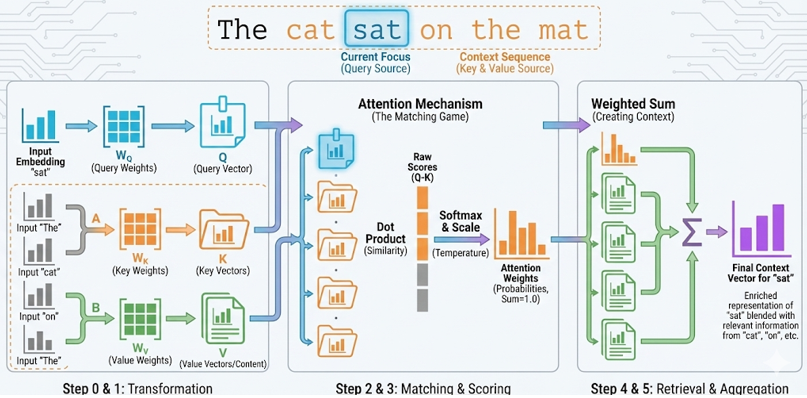
This tutorial explains the Query, Key, Value mechanism in scaled dot-product attention. The goal is to make the data flow obvious: a selected token asks a question with Q, every token offers a searchable label with K, and every token provides retrievable content with V.

The simulation uses small 3-dimensional vectors so every number can be seen. Real Transformer models use much larger vectors, but the mechanism is the same.

Mathematical Foundation

1. Input tokens become vectors

Assume the sentence is:

The cat sat on the mat

Each token is first represented by an input vector X. In a real Transformer, X usually contains token embedding plus positional encoding. In this simulator, each X has only three dimensions so the numbers can be displayed clearly.

For the default preset, the simplified input vectors are:

X(The) = [0.20, 0.80, 0.10]

X(cat) = [0.90, 0.10, 0.40]

X(sat) = [0.60, 0.70, 0.50]

X(on) = [0.10, 0.40, 0.80]

X(the) = [0.20, 0.60, 0.20]

X(mat) = [0.80, 0.20, 0.70]

If sat is selected, then X(sat) is the vector for the token currently being processed. The other tokens are the context that sat may attend to. In self-attention, all tokens, including sat itself, can provide Keys and Values.

2. Q, K, and V are projections of X

Transformer attention does not compare the raw X vectors directly. It first projects X into three different spaces using learned matrices:

Q = X WQ    K = X WK    V = X WV

For the selected token sat, the Query is:

Q(sat) = X(sat) WQ = [0.60,0.70,0.50] WQ = [0.73, 0.77, 0.85]

Q(sat)[0] = X(sat) dot WQ[:,0] = 0.60(0.90)+0.70(0.20)+0.50(0.10) = 0.73

Q(sat)[1] = X(sat) dot WQ[:,1] = 0.60(0.10)+0.70(0.80)+0.50(0.30) = 0.77

Q(sat)[2] = X(sat) dot WQ[:,2] = 0.60(0.20)+0.70(0.40)+0.50(0.90) = 0.85

This Query can be interpreted as the question asked by the token sat: "which tokens in this sentence are relevant to me?"

Every token also produces a Key. The Key is like a searchable label for that token:

K(The) = X(The) WK = [0.20,0.80,0.10] WK = [0.27, 0.78, 0.34]

K(cat) = X(cat) WK = [0.90,0.10,0.40] WK = [0.85, 0.35, 0.44]

K(sat) = X(sat) WK = [0.60,0.70,0.50] WK = [0.70, 0.85, 0.67]

K(on) = X(on) WK = [0.10,0.40,0.80] WK = [0.36, 0.54, 0.77]

K(the) = X(the) WK = [0.20,0.60,0.20] WK = [0.28, 0.62, 0.36]

K(mat) = X(mat) WK = [0.80,0.20,0.70] WK = [0.87, 0.48, 0.70]

Every token also produces a Value. The Value is the content that will be mixed into the output if that token receives attention:

V(The) = X(The) WV = [0.20,0.80,0.10] WV = [0.38, 0.63, 0.35]

V(cat) = X(cat) WV = [0.90,0.10,0.40] WV = [0.65, 0.37, 0.83]

V(sat) = X(sat) WV = [0.60,0.70,0.50] WV = [0.67, 0.76, 0.89]

V(on) = X(on) WV = [0.10,0.40,0.80] WV = [0.34, 0.54, 0.85]

V(the) = X(the) WV = [0.20,0.60,0.20] WV = [0.34, 0.52, 0.40]

V(mat) = X(mat) WV = [0.80,0.20,0.70] WV = [0.68, 0.51, 1.07]

So Q is the request, K is the matching label, and V is the content to retrieve.

3. Query-Key dot product gives a match score

Now the Query from sat is compared against every Key:

scorei = Q(sat) · Ki

For example, the match score between sat's Query and cat's Key is:

score(cat) = Q(sat) · K(cat) = (0.73)(0.85)+(0.77)(0.35)+(0.85)(0.44) = 1.26

The simulator rounds this to 1.26. Doing this for every token gives:

score(The) = Q(sat) · K(The) = (0.73)(0.27)+(0.77)(0.78)+(0.85)(0.34) = 1.09

score(cat) = Q(sat) · K(cat) = (0.73)(0.85)+(0.77)(0.35)+(0.85)(0.44) = 1.26

score(sat) = Q(sat) · K(sat) = (0.73)(0.70)+(0.77)(0.85)+(0.85)(0.67) = 1.73

score(on) = Q(sat) · K(on) = (0.73)(0.36)+(0.77)(0.54)+(0.85)(0.77) = 1.33

score(the) = Q(sat) · K(the) = (0.73)(0.28)+(0.77)(0.62)+(0.85)(0.36) = 0.99

score(mat) = Q(sat) · K(mat) = (0.73)(0.87)+(0.77)(0.48)+(0.85)(0.70) = 1.60

The largest raw score is for sat itself. This means, with these demonstration vectors, the Query generated by sat is most aligned with the Key generated by sat.

4. Scaling and softmax convert scores into weights

Raw dot products can grow large when the vector dimension is large. To control this, scaled dot-product attention divides each score by sqrt(dk). In this tutorial, dk = 3, so:

sqrt(dk) = sqrt(3) = 1.73

For the cat score:

scaled score(cat) = 1.26 / 1.73 = 0.73

The scaled scores are approximately:

scaled score(The) = score(The) / sqrt(dk) = 1.09 / 1.73 = 0.63

scaled score(cat) = score(cat) / sqrt(dk) = 1.26 / 1.73 = 0.73

scaled score(sat) = score(sat) / sqrt(dk) = 1.73 / 1.73 = 1.00

scaled score(on) = score(on) / sqrt(dk) = 1.33 / 1.73 = 0.77

scaled score(the) = score(the) / sqrt(dk) = 0.99 / 1.73 = 0.57

scaled score(mat) = score(mat) / sqrt(dk) = 1.60 / 1.73 = 0.92

Softmax then converts these scaled scores into positive weights that sum to 1.0:

weighti = exp(scaled scorei) / sum(exp(scaled scorej))

With temperature = 1.0, the attention weights are approximately:

weight(The) = exp(0.63) / [exp(0.63)+exp(0.73)+exp(1.00)+exp(0.77)+exp(0.57)+exp(0.92)] = 0.14

weight(cat) = exp(0.73) / [exp(0.63)+exp(0.73)+exp(1.00)+exp(0.77)+exp(0.57)+exp(0.92)] = 0.16

weight(sat) = exp(1.00) / [exp(0.63)+exp(0.73)+exp(1.00)+exp(0.77)+exp(0.57)+exp(0.92)] = 0.21

weight(on) = exp(0.77) / [exp(0.63)+exp(0.73)+exp(1.00)+exp(0.77)+exp(0.57)+exp(0.92)] = 0.16

weight(the) = exp(0.57) / [exp(0.63)+exp(0.73)+exp(1.00)+exp(0.77)+exp(0.57)+exp(0.92)] = 0.13

weight(mat) = exp(0.92) / [exp(0.63)+exp(0.73)+exp(1.00)+exp(0.77)+exp(0.57)+exp(0.92)] = 0.19

These values sum to 1.0. The token sat receives the highest weight because it had the highest scaled score. The temperature slider is included only for learning: lower temperature makes the largest score dominate more strongly; higher temperature spreads the weights more evenly.

5. Values are mixed by the weights

The final attention output is not one of the tokens. It is a weighted mixture of the Value vectors:

Output = sum(weighti Vi)

For dimension 0, the calculation is:

Output[0] = sum weight(token)V(token)[0] = 0.14(0.38)+0.16(0.65)+0.21(0.67)+0.16(0.34)+0.13(0.34)+0.19(0.68) = 0.52

For dimension 1:

Output[1] = sum weight(token)V(token)[1] = 0.14(0.63)+0.16(0.37)+0.21(0.76)+0.16(0.54)+0.13(0.52)+0.19(0.51) = 0.56

For dimension 2:

Output[2] = sum weight(token)V(token)[2] = 0.14(0.35)+0.16(0.83)+0.21(0.89)+0.16(0.85)+0.13(0.40)+0.19(1.07) = 0.75

The final output vector is approximately:

Output = [Output[0], Output[1], Output[2]] = [0.52, 0.56, 0.75] = [0.52, 0.56, 0.75]

So Keys decide where to attend, and Values decide what information is retrieved. In this example, sat and mat contribute strongly because their attention weights are relatively large.

Complete formula

The whole operation is summarized as:

Attention(Q,K,V) = softmax(QKT / sqrt(dk)) V

For this concrete example, the selected token is sat. Its Query is compared with all Keys, the scores are converted into attention weights, and those weights mix all Value vectors into the final context vector.

Simulation

The interactive simulator is below. Use the controls to explore the concepts described above.

1.00

Tokens and input vectors X

Attention pipeline

Scores and weights

Token

Q·K

/sqrt(dk)

Weight

Softmax attention weights

Output context vector

Formula note

Usage Instructions

  1. Choose a preset: Select a short sentence. Every token in the sentence has an input vector X.
  2. Choose a query token: This is the token currently being processed. Its vector creates Q. Click a token in the left panel as a shortcut.
  3. Step through the pipeline: Use Step Fwd, Step Bwd, or Run to move through the five stages: choose token, project Q/K/V, score Q dot K, softmax weights, and weighted sum.
  4. Read the score table: Q·K is the raw match score. The scaled score divides by sqrt(dk). Weight is the softmax result.
  5. Inspect the weights: A large weight means that token's Value vector contributes strongly to the final output.
  6. Adjust temperature: Lower values make one token dominate. Higher values spread attention across more tokens.

What To Notice

  • Q is not stored memory: Q is the selected token's request.
  • K is not the content: K is the matching label used for scoring.
  • V is the content: V is what gets mixed into the output.
  • Softmax does not create content: It only decides how much of each Value to use.
  • The output is not one token: It is a vector mixture of all Values, weighted by attention.

Parameters

  • Preset: Selects the token sequence and small demonstration vectors.
  • Query token: Selects which token generates the Query Q.
  • Temperature: Divides scaled scores before softmax. It is shown as a teaching control; standard attention usually uses temperature 1.
  • Animation: Steps through the same calculation used in the formula.

Limitations

  • Single head, single query. One attention head is shown for one selected query token at a time. Real attention computes the full QKT matrix for all tokens and runs many heads in parallel (see the Multi-Head page).
  • Toy dimensions. Tokens are 3D and the sentence has a handful of words for readability; production models use hundreds/thousands of dimensions and long contexts where the √dk scaling matters much more.
  • Fixed, untrained projections. WQ, WK, WV are demonstration matrices. There is no learning, so the resulting attention pattern is illustrative, not something the model discovered.
  • No masking or positional encoding. All tokens attend to all tokens (full self-attention); causal masking, padding masks, and positional information are not modeled.
  • Temperature is a teaching aid. The temperature slider is included to show how softmax sharpness changes weights; standard scaled dot-product attention uses temperature 1.
  • Rounded arithmetic. Scores, weights, and outputs are shown to two decimals, so the displayed softmax weights may not sum to exactly 1.00.
  • Teaching tool. Built to make the Query/Key/Value retrieval analogy and the attention formula concrete, not to reproduce a trained attention layer.