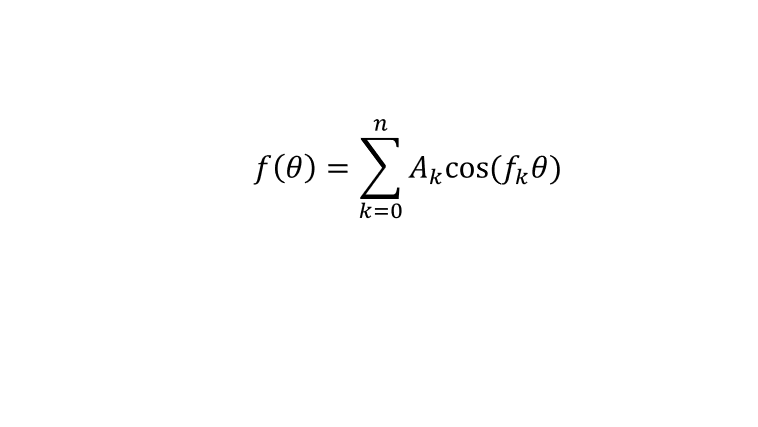
|
Followings are the code that I wrote in Octave to creates all the plots shown in this page. You may copy these code and play with these codes. Change variables and try yourself until you get your own intuitive understanding.
< Code 1 >
a1 = 1;
f1 = 1;
a2 = 1/3;
f2 = 3;
a3 = 1/5;
f3 = 5;
a4 = 1/7;
f4 = 7;
yAmp = 1.5;
thLeft_01 = -2*pi:pi/20:0.0 ;
thRight_01 = 0.0:pi/20:2*pi;
thLeft_02 = -2*pi:pi/20:0.0 ;
thRight_02 = 0.0:pi/20:2*pi;
thLeft_03 = -2*pi:pi/20:0.0 ;
thRight_03 = 0.0:pi/20:2*pi;
thLeft_04 = -2*pi:pi/20:0.0 ;
thRight_04 = 0.0:pi/20:2*pi;
thSum = -2*pi:pi/20:2*pi;
hFig = figure(1);
clf;
subplot(5,1,1);
plot(thLeft_01,a1 .* sin(f1 .* thLeft_01),'b-','LineWidth',2,thRight_01,a1 .* sin(f1 .* thRight_01),'r-','LineWidth',2);
axis([-2*pi 2*pi -yAmp yAmp]);
set(gca,'xtick',[-2*pi -1.5*pi -pi -0.5*pi 0 pi/2 pi 1.5*pi 2*pi]);
set(gca,'xticklabel',{'-2 pi','-1.5 pi','-pi','-0.5 pi','0','0.5','pi','1.5 pi','2 pi'});
tString = sprintf('%0.2f sin(%0.1f \\theta)',a1,f1);
title(tString,'FontSize',20);
grid on;
subplot(5,1,2);
plot(thLeft_02,a2 .* sin(f2 .* thLeft_02),'b-','LineWidth',2,thRight_02,a2 .* sin(f2 .* thRight_02),'r-','LineWidth',2);
axis([-2*pi 2*pi -yAmp yAmp]);
set(gca,'xtick',[-2*pi -1.5*pi -pi -0.5*pi 0 pi/2 pi 1.5*pi 2*pi]);
set(gca,'xticklabel',{'-2 pi','-1.5 pi','-pi','-0.5 pi','0','0.5','pi','1.5 pi','2 pi'});
tString = sprintf('%0.2f sin(%0.1f \\theta)',a2,f2);
title(tString,'FontSize',20);
grid on;
subplot(5,1,3);
plot(thLeft_03,a3 .* sin(f3 .* thLeft_03),'b-','LineWidth',2,thRight_03,a3 .* sin(f3 .* thRight_03),'r-','LineWidth',2);
axis([-2*pi 2*pi -yAmp yAmp]);
set(gca,'xtick',[-2*pi -1.5*pi -pi -0.5*pi 0 pi/2 pi 1.5*pi 2*pi]);
set(gca,'xticklabel',{'-2 pi','-1.5 pi','-pi','-0.5 pi','0','0.5','pi','1.5 pi','2 pi'});
tString = sprintf('%0.2f sin(%0.1f \\theta)',a3,f3);
title(tString,'FontSize',20);
grid on;
subplot(5,1,4);
plot(thLeft_04,a4 .* sin(f4 .* thLeft_04),'b-','LineWidth',2,thRight_04,a4 .* sin(f4 .* thRight_04),'r-','LineWidth',2);
axis([-2*pi 2*pi -yAmp yAmp]);
set(gca,'xtick',[-2*pi -1.5*pi -pi -0.5*pi 0 pi/2 pi 1.5*pi 2*pi]);
set(gca,'xticklabel',{'-2 pi','-1.5 pi','-pi','-0.5 pi','0','0.5','pi','1.5 pi','2 pi'});
tString = sprintf('%0.2f sin(%0.1f \\theta)',a4,f4);
title(tString,'FontSize',20);
grid on;
subplot(5,1,5);
sinSum = a1 .* sin(f1 .* thSum) .+ a2 .* sin(f2 .* thSum) .+ a3 .* sin(f3 .* thSum) .+ a4 .* sin(f4 .* thSum);
plot(thSum,sinSum,'k-','LineWidth',2);
axis([-2*pi 2*pi -yAmp yAmp]);
set(gca,'xtick',[-2*pi -1.5*pi -pi -0.5*pi 0 pi/2 pi 1.5*pi 2*pi]);
set(gca,'xticklabel',{'-2 pi','-1.5 pi','-pi','-0.5 pi','0','0.5','pi','1.5 pi','2 pi'});
tString = sprintf('%0.2f sin(%0.1f \\theta)+%0.2f sin(%0.1f \\theta)+%0.2f sin(%0.1f \\theta)+%0.2f sin(%0.1f \\theta)',a1,f1,a2,f2,a3,f3,a4,f4);
title(tString,'FontSize',20);
grid on;
set(hFig,'Position',[300 100 800 900]);
< Code 2 >
a1 = 1;
f1 = 1;
a2 = 1/3;
f2 = 2;
a3 = 1/5;
f3 = 3;
a4 = 1/7;
f4 = 4;
a5 = 1/9;
f5 = 5;
a6 = 1/11;
f6 = 6;
a7 = 1/13;
f7 = 7;
a8 = 1/15;
f8 = 8;
yAmp = 1.5;
thLeft_01 = -2*pi:pi/20:0.0 ;
thRight_01 = 0.0:pi/20:2*pi;
thLeft_02 = -2*pi:pi/20:0.0 ;
thRight_02 = 0.0:pi/20:2*pi;
thLeft_03 = -2*pi:pi/20:0.0 ;
thRight_03 = 0.0:pi/20:2*pi;
thLeft_04 = -2*pi:pi/20:0.0 ;
thRight_04 = 0.0:pi/20:2*pi;
thLeft_05 = -2*pi:pi/20:0.0 ;
thRight_05 = 0.0:pi/20:2*pi;
thLeft_06 = -2*pi:pi/20:0.0 ;
thRight_06 = 0.0:pi/20:2*pi;
thLeft_07 = -2*pi:pi/20:0.0 ;
thRight_07 = 0.0:pi/20:2*pi;
thLeft_08 = -2*pi:pi/20:0.0 ;
thRight_08 = 0.0:pi/20:2*pi;
thSum = -2*pi:pi/20:2*pi;
hFig = figure(1);
clf;
subplot(5,2,1);
plot(thLeft_01,a1 .* sin(f1 .* thLeft_01),'b-','LineWidth',2,thRight_01,a1 .* sin(f1 .* thRight_01),'r-','LineWidth',2);
axis([-2*pi 2*pi -yAmp yAmp]);
set(gca,'xtick',[-2*pi -1.5*pi -pi -0.5*pi 0 pi/2 pi 1.5*pi 2*pi]);
set(gca,'xticklabel',{'-2 pi','-1.5 pi','-pi','-0.5 pi','0','0.5','pi','1.5 pi','2 pi'});
tString = sprintf('%0.2f sin(%0.1f \\theta)',a1,f1);
title(tString,'FontSize',20);
grid on;
subplot(5,2,2);
plot(thLeft_02,a2 .* sin(f2 .* thLeft_02),'b-','LineWidth',2,thRight_02,a2 .* sin(f2 .* thRight_02),'r-','LineWidth',2);
axis([-2*pi 2*pi -yAmp yAmp]);
set(gca,'xtick',[-2*pi -1.5*pi -pi -0.5*pi 0 pi/2 pi 1.5*pi 2*pi]);
set(gca,'xticklabel',{'-2 pi','-1.5 pi','-pi','-0.5 pi','0','0.5','pi','1.5 pi','2 pi'});
tString = sprintf('%0.2f sin(%0.1f \\theta)',a2,f2);
title(tString,'FontSize',20);
grid on;
subplot(5,2,3);
plot(thLeft_03,a3 .* sin(f3 .* thLeft_03),'b-','LineWidth',2,thRight_03,a3 .* sin(f3 .* thRight_03),'r-','LineWidth',2);
axis([-2*pi 2*pi -yAmp yAmp]);
set(gca,'xtick',[-2*pi -1.5*pi -pi -0.5*pi 0 pi/2 pi 1.5*pi 2*pi]);
set(gca,'xticklabel',{'-2 pi','-1.5 pi','-pi','-0.5 pi','0','0.5','pi','1.5 pi','2 pi'});
tString = sprintf('%0.2f sin(%0.1f \\theta)',a3,f3);
title(tString,'FontSize',20);
grid on;
subplot(5,2,4);
plot(thLeft_04,a4 .* sin(f4 .* thLeft_04),'b-','LineWidth',2,thRight_04,a4 .* sin(f4 .* thRight_04),'r-','LineWidth',2);
axis([-2*pi 2*pi -yAmp yAmp]);
set(gca,'xtick',[-2*pi -1.5*pi -pi -0.5*pi 0 pi/2 pi 1.5*pi 2*pi]);
set(gca,'xticklabel',{'-2 pi','-1.5 pi','-pi','-0.5 pi','0','0.5','pi','1.5 pi','2 pi'});
tString = sprintf('%0.2f sin(%0.1f \\theta)',a4,f4);
title(tString,'FontSize',20);
grid on;
subplot(5,2,5);
plot(thLeft_05,a5 .* sin(f5 .* thLeft_05),'b-','LineWidth',2,thRight_05,a5 .* sin(f5 .* thRight_05),'r-','LineWidth',2);
axis([-2*pi 2*pi -yAmp yAmp]);
set(gca,'xtick',[-2*pi -1.5*pi -pi -0.5*pi 0 pi/2 pi 1.5*pi 2*pi]);
set(gca,'xticklabel',{'-2 pi','-1.5 pi','-pi','-0.5 pi','0','0.5','pi','1.5 pi','2 pi'});
tString = sprintf('%0.2f sin(%0.1f \\theta)',a5,f5);
title(tString,'FontSize',20);
grid on;
subplot(5,2,6);
plot(thLeft_06,a6 .* sin(f6 .* thLeft_06),'b-','LineWidth',2,thRight_06,a6 .* sin(f6 .* thRight_06),'r-','LineWidth',2);
axis([-2*pi 2*pi -yAmp yAmp]);
set(gca,'xtick',[-2*pi -1.5*pi -pi -0.5*pi 0 pi/2 pi 1.5*pi 2*pi]);
set(gca,'xticklabel',{'-2 pi','-1.5 pi','-pi','-0.5 pi','0','0.5','pi','1.5 pi','2 pi'});
tString = sprintf('%0.2f sin(%0.1f \\theta)',a6,f6);
title(tString,'FontSize',20);
grid on;
subplot(5,2,7);
plot(thLeft_07,a7 .* sin(f7 .* thLeft_07),'b-','LineWidth',2,thRight_07,a7 .* sin(f7 .* thRight_07),'r-','LineWidth',2);
axis([-2*pi 2*pi -yAmp yAmp]);
set(gca,'xtick',[-2*pi -1.5*pi -pi -0.5*pi 0 pi/2 pi 1.5*pi 2*pi]);
set(gca,'xticklabel',{'-2 pi','-1.5 pi','-pi','-0.5 pi','0','0.5','pi','1.5 pi','2 pi'});
tString = sprintf('%0.2f sin(%0.1f \\theta)',a7,f7);
title(tString,'FontSize',20);
grid on;
subplot(5,2,8);
plot(thLeft_08,a8 .* sin(f8 .* thLeft_08),'b-','LineWidth',2,thRight_08,a8 .* sin(f8 .* thRight_08),'r-','LineWidth',2);
axis([-2*pi 2*pi -yAmp yAmp]);
set(gca,'xtick',[-2*pi -1.5*pi -pi -0.5*pi 0 pi/2 pi 1.5*pi 2*pi]);
set(gca,'xticklabel',{'-2 pi','-1.5 pi','-pi','-0.5 pi','0','0.5','pi','1.5 pi','2 pi'});
tString = sprintf('%0.2f sin(%0.1f \\theta)',a8,f8);
title(tString,'FontSize',20);
grid on;
subplot(5,2,[9 10]);
sinSum = a1 .* sin(f1 .* thSum) .+ a2 .* sin(f2 .* thSum) .+ a3 .* sin(f3 .* thSum) .+ a4 .* sin(f4 .* thSum) ...
+ a5 .* sin(f5 .* thSum) .+ a6 .* sin(f6 .* thSum) .+ a7 .* sin(f7 .* thSum) .+ a8 .* sin(f8 .* thSum);
plot(thSum,sinSum,'k-','LineWidth',2);
axis([-2*pi 2*pi -yAmp yAmp]);
set(gca,'xtick',[-2*pi -1.5*pi -pi -0.5*pi 0 pi/2 pi 1.5*pi 2*pi]);
set(gca,'xticklabel',{'-2 pi','-1.5 pi','-pi','-0.5 pi','0','0.5','pi','1.5 pi','2 pi'});
tString = 'Summation of all the functions above';
title(tString,'FontSize',20);
grid on;
set(hFig,'Position',[300 100 800 900]);
|