Bit Error/BER (Bit Error Rate)
What is Bit Error ?
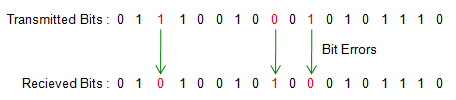
The answer is simple. If the received bit is different from the transmitted bit, it is said that the data has bit error. As an example,if you have the transmitted bit stream and received bit stream as shown below, we can say this bit stream (data stream) has 3 bit errors. You see there are three locations where the transmitted bit and received bit is different.
What is Bit Error Rate ?
It is the ratio of the number of bit errors and the total number of transmitted bits. It would be clear if you have a simple example as follows.
Example >
A million bits (10^6) was transmitted and 243 bits were found to be errors at the reciever. What is the bit error rate ?
Ans : Bit Error Rate = (Number of Error Bits)/(Number of Transmitted Bits) = 243/10^6 = 2.43 x 10^-4
Why BER is important ?
One of the critical function (goal) of any communication system is to transmit and receive data without any error. That is, the communication system has as little BER as possible during transmission and reception process.
Therefore, BER is a very important indicator to show how good a communication system is designed.
In order to prove that a communication system is desinged well, you have to prove that the estimated (theoretically calculated BER) is lower than a certain acceptance level and the measured BER after building the device is lower than a certain acceptance level.
How to measure BER ?
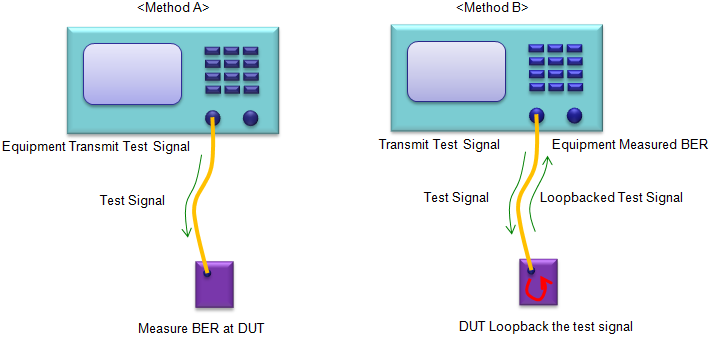
There are roughly two different method of BER measurement which is widely used in communication industry as illustrated below.
In method A, an equipment generate and transmit a special test signal to DUT(Device Under Test) and after recieving/decoding the received signal, the DUT measure BER. In order to do this way, the DUT should know exactly what is the transmitted data. Usually we use a known/fixed bit stream (e.g, predefined test Vector) or a bit stream that can be generated by a known algorithm (e.g, PN data)
In method B, an equipment generate and transmit a special test signal to DUT, the DUT receive and transmit it back to the equipment and the equipment compares what it transmitted and what it received from DUT. In this case, DUT does not need to know what is the test signal. In many wireless communication (e.g, Bluetooth, WCDMA) this kind of method is used. The industry standard defines a specific test mode (e.g, Test Loopback Mode) to measure BER in this method.
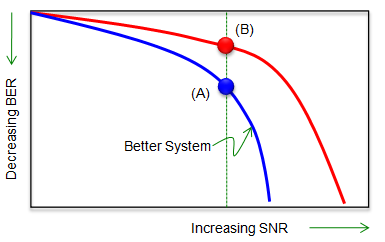
Usually for most of casual testing (e.g, Testing during Manufacturing for simple pass/fail, we normally measure BER only once at a predefined condition (e.g, at a specified power level and SNR), but during the design and development phase we normally do more through testing with various condition. The most common way of testing during this phase would be to measure BER at various SNR and take the plot as shown below. You may have seen this kind of plot very often from various papers and test report.
When you see any kind of graph (plot), you need to have very clear understanding of the meaning of each axis. (Somehow this plot has confused me for a long time. It may not be so confusing to you... but somehow it confused me any way). Following is summary of the meaning of each axis.
i) y axis (vertical axis) represents BER.
ii) Downward direction on vertical axis represents lower BER.
iii) Upward direction on vertical axis represents higher BER.
iv) Higher value along Y direction means higher BER and in turn means poor performance.
v) x axis (horizontal axis) represents SNR.
vi) Rightward direction on horizontal axis represents higher SNR,meaning good signal quality. (Less noise comparing to signal level)
vii) Leftward direction on horizontal axis represents lower SNR, meaning poor signal quality. (High noise comparing to signal level)
With all of these details in mind, if you compare the two plots (red and blue) in the following example, you should be able to intuitively catch that Blue line indicates better performance comparing to Red line.
And comparing two dots labeled (A) and (B) which are at the same SNR, you should know (A) is showing better performance than (B) since (A) has less BER.
How to evaluate the BER ? (Mathematical Model of BER)
Now let's get into a little bit of theoretical part which may be a little boring to some of readers. But you should be familiar with this kind of things if you want to read papers and technical documents about the communication system. I will try to visualize as much as possible, but I would not be able to avoid using mathematics.
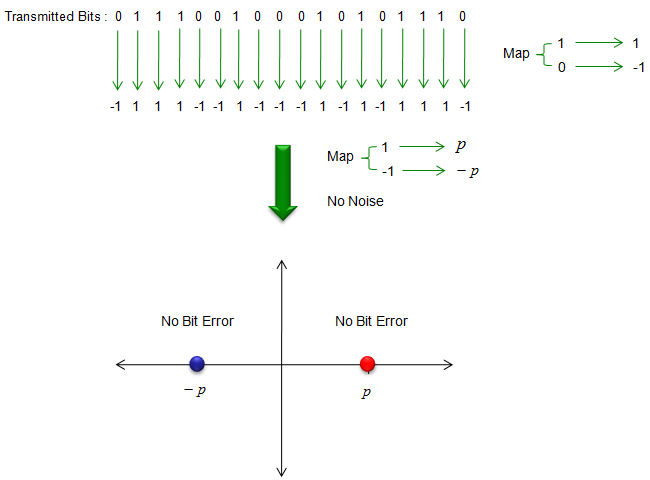
Just for simplicity and clarity, let's assume one of the simplest situation of communication. In any communication, there is a bit stream you want to send. In most of the communication (especialy mobile communication), you change (map) 0 and 1 into another number (e.g +1 and -1). You can take this step as a modulation or source encoding (very simple). And the finally the modulated (or source coded) number is mapped to real electric voltage(in this case, the electric voltage is labeled as 'p' and '-p'). You can say the data '-p' is mapped to '-p mV' and '+1' is mapped to '+p mV' in real transmission. With this mapping, you would have the constellation as shown at the bottom of the following illustration. If we assume there is no noise at all, you would see only two clear dots (constellation) even though you transmit a lot of data. all the -1s are supperimposed onto the single blue dot and all the +1s are superimposed onto the single red dot. This is the case where SNR is finitely large and no Bit Error at all.
Now let's assume that the communication system is exposed to a noise. In most case (practically in all case), noise has a random characteristics. It cannot be modeled (explained) as any deterministic/fixed pattern. If any noise has any fixed/deterministic pattern, we don't have to worry about the noise since we can remove the fixed/deterministic noise very easily. But in reality, none of the noise is determistic and the pattern of a noise can only be explained by a certain statistical model. So whenever you want to analyze a system under a noise, you have to define (figure out) the statistical property of the noise first.
In most case, we assume that the noise has property of statistical model called 'Normal Distrubution'. You may ask how do you know the noise follows 'Normal Distribution' ? but just hold back this question a little while. It is not based on any random guess.. it has also some theoretical background called 'Central limit theorem'. (I would explain on Centeral Limit Theorem in a separate page later). now.. let's just assume that noise has a Normal Distribution.
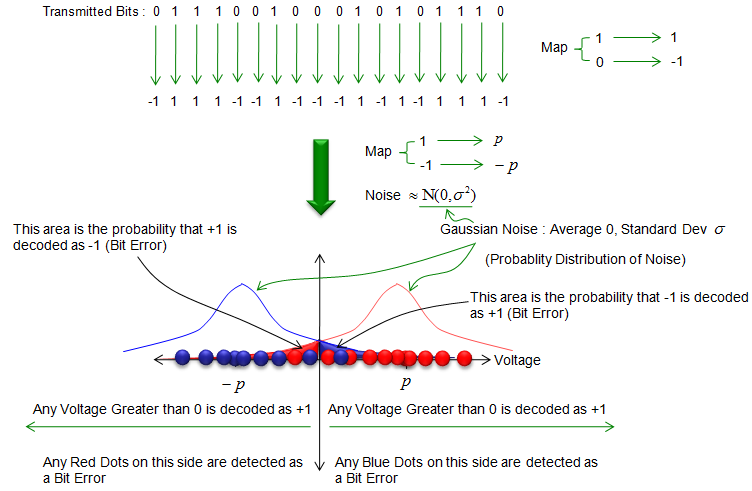
Under this noisy situation, all the data does not superimpose onto a single dots any more. Those data would map onto a lot of dots scattered around the ideal location. Most of the dots still appear closer to the ideal location, but some of the dots would deviate very far away from the ideal location.
Not all of the deviated dots cause Bit Error. In this specific example, any red dots can still be decoded as '+1' as long as it stays on the right side of graph and any blue dots can still be decoded as '-1' as long as it stays on the left side of the graph. In that case, the deviation does not cause Bit Error. But if a dot deviated so much that the red dots appear on the left side of the graph or the blue dots appear on the right side, those deviated dots cause Bit Error rate.
Since the deviation of the dot location is caused by the noise and the noise is based on Normal distribution, the deviation of dots from the ideal location can be explained by Normal distribution.
The deviation that cause Bit Error is the case where the red dot falls into the left side of the graph. So the probability of Bit Error for red dot and the probability of Bit Error for blue dot can be illustrated as shown at the bottom of the following illustration.
I am not sure my explanation/illustration is clear enough to you, but try to completely understand this and try to study on basic statiscal concept if necessary. It would not require high level statistics.. probably refreshing yourself with what you learned during high school data management course.
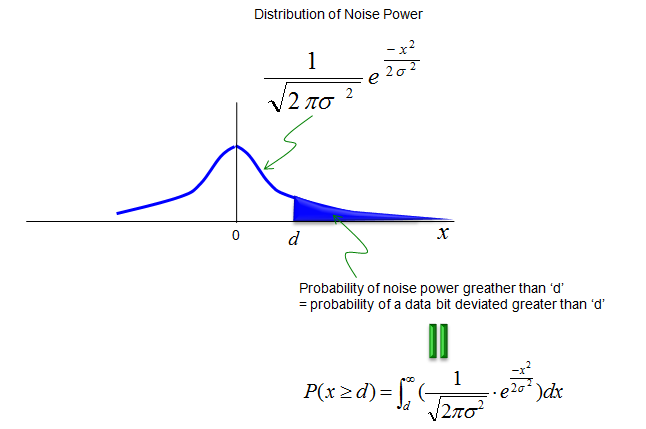
Now let's get one step further deeper into mathematical analysis of BER. As I mentioned above, we assume that noise has property of normal distribution and the graph of Normal Distribution can be represented as below. Also as I mentioned, BER means the probablity that a noise power becomes larger than a certain level (criteria). So mathematical analysis of BER can be done simply by taking the area after a certain value under the normal distribution graph as shown below.
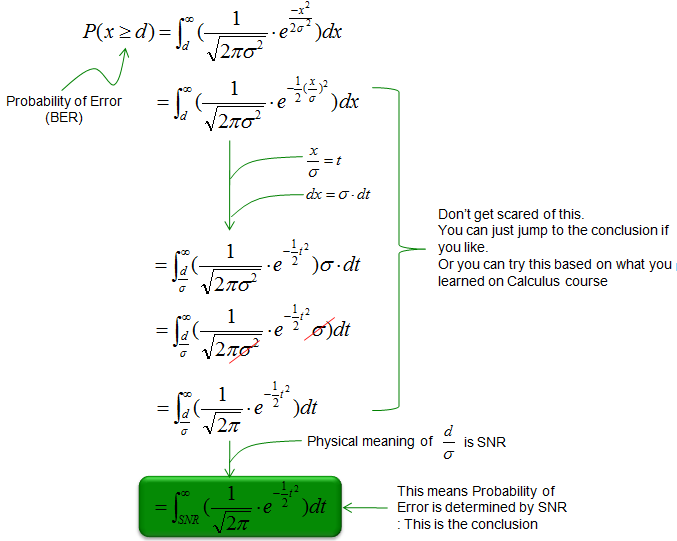
Now let's modify the equation above into a form that is closer to physical mean and that can be solved a little bit easily. If this is too much for you, you can just skip this part. Nobody would go through this step everytime they have to calculate BER. There is a lot of software (even pocket calculate) that can do this for you. But you need to understand the meaning of this mathematical form and why we need to do this.
How to improve (decrease) BER ?
I am sure everybody would want to know the answer to this question. Mathematical answer is simple, but as you know Simple mathematical solution does not mean simple physical solution. I would see only the mathematical aspect of reducing BER.
Since BER means the area under the normal distribution that is greater (or less) than a certain level, if you reduce this area you would have less BER.
We can think of two easy way of doing it ('easy' in terms of mathematical aspect).
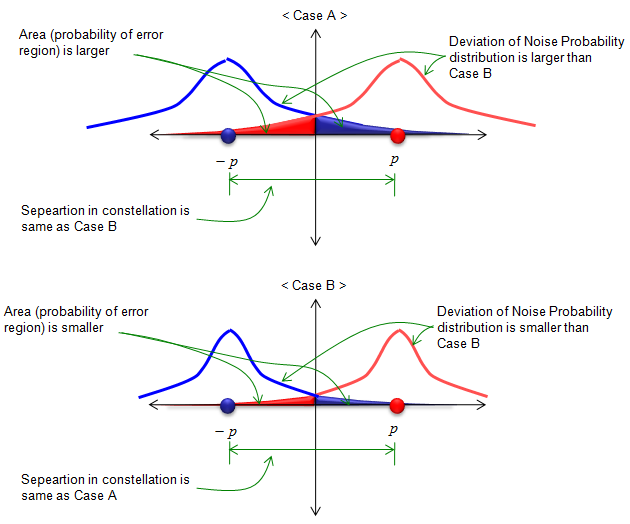
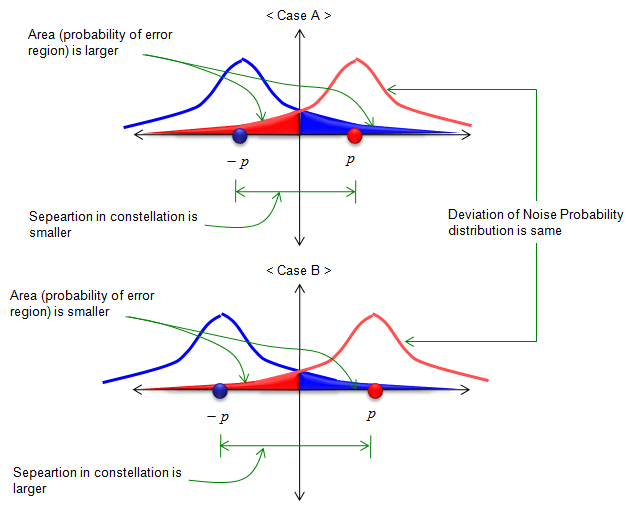
First method is to increase the threshold value (labeled as 'p' and '-p' in the following illustration). If you compare <Case A> and <Case B>, you can intuitively notice that <Case B> has less area of Bit Error. But the physical meaning of 'increasing p' as illustrated below means transmitting the bit in higher power (higher voltage) which would cause more engergy consumption.
Second method is to reduce the area of Bit Error is to reduce the deviation of the probabability distribution function. if you compare <Case A> and <Case B> in the following illustration, you would notice that <Case B> would have less BER. But this is not easy to achieve in real implemenation. Less deviation of the probability distribution function means less mean power of the noise. However, in many case we don't have any control of chaning the property of noise.