5G/NR - Pre Trial - Physical Signal - BRS
NOTE : This note is about a tempary 5G specification that was implemented and tried before 5G specification is finalized. I keep this note for study purpose.
BRS (Beam Reference Signal)
|
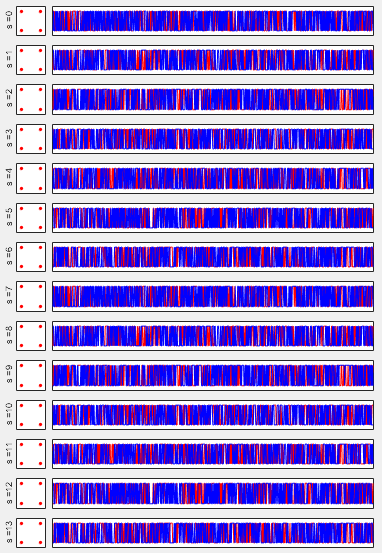
BRS Full |
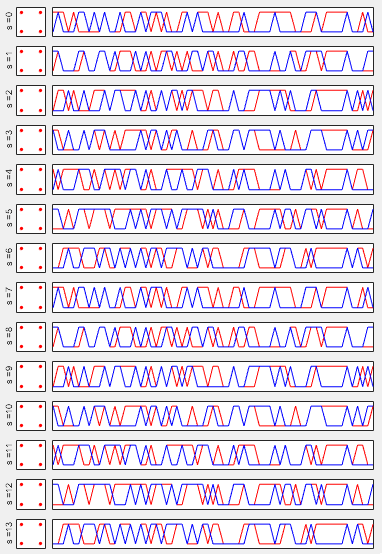
BRS - Initial 62 data |
|
|
|
Disclaimer : This code is just to push myself (probably readers) to look into the algorithm (formula) specified in the specification to the most detailed level. If you try to convert the specification into the programming code whatever language you choose, you will understand the equation / algorithm in much more detailed level than just reading the document. However, this code has not been verified with any real data.
|
Filename : Generate_Brs.m Last Update : Dec 24, 2016 |
|
%V5G.211 - 6.7.4.1 function SequenceBrs = Generate_Brs(BRS)
NID_Cell = BRS.NID_Cell; N_RB_MAX_DL = BRS.N_RB_MAX_DL;
r_m = [];
for l = 0:13
% Generate Psuedo Random Sequence ns = floor(1/7); lp = mod(l,7); C_init = 2^10 * (7*(ns + 1) + lp + 1) * (2 * NID_Cell + 1) + 2 * NID_Cell + 1;
r_m_l = []; c_m_even = []; c_m_odd = [];
PR.x2_init = C_init;
for m = 0 : (8*(N_RB_MAX_DL-18)-1) PR.n = 2*m; c_m = Generate_PR(PR); c_m_even = [c_m_even c_m]; PR.n = 2*m+1; c_m = Generate_PR(PR); c_m_odd = [c_m_odd c_m]; end;
r_m_l = (1 ./ sqrt(2) * (1 - 2 .* c_m_even)) + (j .* 1 ./ sqrt(2) * (1 - 2 .* c_m_odd));
r_m = [r_m ; r_m_l];
end;
SequenceBrs.r_m = r_m;
end |
|
Filename : PlotSequence_Brs.m Last Update : Dec 24, 2016 |
|
function h=PlotSequence_Brs(BrsSequence,PlotOption)
plotData = BrsSequence.r_m; if isfield(PlotOption,'NumOfDataToPlot') == 1 NumOfDataToPlot = PlotOption.NumOfDataToPlot; end;
w = 10;
for l = 0:13 d_n=plotData(l+1,:);
subplot(14,w,(l*w)+1); plot(real(d_n),imag(d_n),'ro', ... 'MarkerFaceColor',[1 0 0],'MarkerSize',2); set(gca,'xticklabel',[]);set(gca,'yticklabel',[]); set(gca,'xtick',[]);set(gca,'ytick',[]); ylabel(strcat('s = ',num2str(l))); set(gca,'fontsize',6);
subplot(14,w,[((l*w)+2) ((l*w)+w)]); n = 0:length(d_n)-1; plot(n,real(d_n),'r-',n,imag(d_n),'b-'); if exist('NumOfDataToPlot') == 1 xlim([0 NumOfDataToPlot]); else xlim([0 n(end)]); end; set(gca,'xticklabel',[]);set(gca,'yticklabel',[]); set(gca,'xtick',[]);set(gca,'ytick',[]); end
end |
|
Filename : Test_Generation_Brs.m Last Update : Dec 24, 2016 |
|
clear PlotOption = [];
BRS.NID_Cell = 0; BRS.N_RB_MAX_DL = 100;
BrsSequence = Generate_Brs(BRS);
%PlotOption.NumOfDataToPlot = 62; PlotSequence_Brs(BrsSequence,PlotOption);
|