|
Python |
|||
|
Matplotlib
One of the feature that I thought of as the limitation of Python was lack of graphics/plot function. However, even if it is not a part of basic installation, you can add very powerful graphics/plot functionality like Matlab by installing a special library called matplotlib. You can get the library from following location.
Official Site : http://matplotlib.org/
Installation
You can download and install the package from the above link, or install using pip as shown below. Definately I prefer pip method.
c:\Python35>pip install matplotlib
Collecting matplotlib Downloading matplotlib-1.5.3-cp35-cp35m-win32.whl (6.2MB) 100% |################################| 6.2MB 178kB/s Requirement already satisfied: numpy>=1.6 in c:\python35\lib\site-packages (from matplotlib) Requirement already satisfied: python-dateutil in c:\python35\lib\site-packages (from matplotlib) Collecting pyparsing!=2.0.4,!=2.1.2,>=1.5.6 (from matplotlib) Downloading pyparsing-2.1.10-py2.py3-none-any.whl (56kB) 100% |################################| 61kB 5.1MB/s Collecting cycler (from matplotlib) Downloading cycler-0.10.0-py2.py3-none-any.whl Requirement already satisfied: pytz in c:\python35\lib\site-packages (from matpl otlib) Requirement already satisfied: six>=1.5 in c:\python35\lib\site-packages (from p ython-dateutil->matplotlib) Installing collected packages: pyparsing, cycler, matplotlib Successfully installed cycler-0.10.0 matplotlib-1.5.3 pyparsing-2.1.10
Basic Check
Once you installed the package, try quick check whether it is properly installed or not. You can simply type in several lines of commands as shown below.
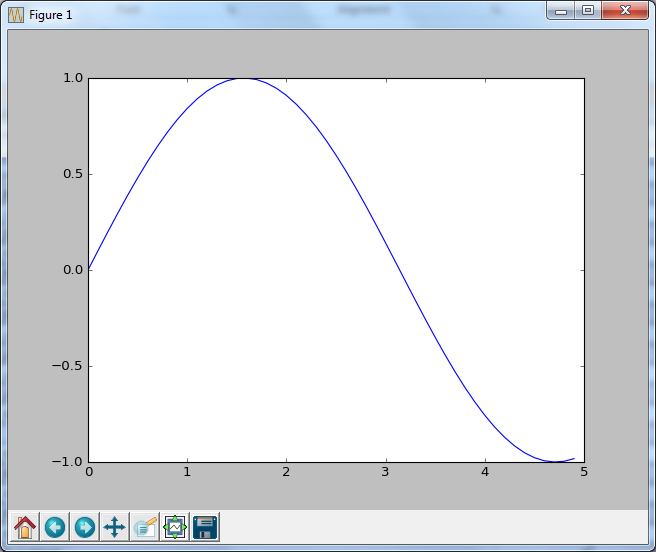
>>> import numpy as np >>> import matplotlib.pyplot as plt
>>> x = np.arange(0, 5, 0.1); >>> y = np.sin(x); >>> plt.plot(x, y) [<matplotlib.lines.Line2D object at 0x05D61FB0>] >>> plt.show()
or create a file as below and run.
NOTE : Matplotlib functionality and concept is very similar to the plotting in Matlab. If you are familiar with Matlab plot functions, you would catch up Matplotlib functions very easily.
Reference :
[1] Matplotlib tutorial (Nicolas P. Rougier)
|
|||