|
|
||
|
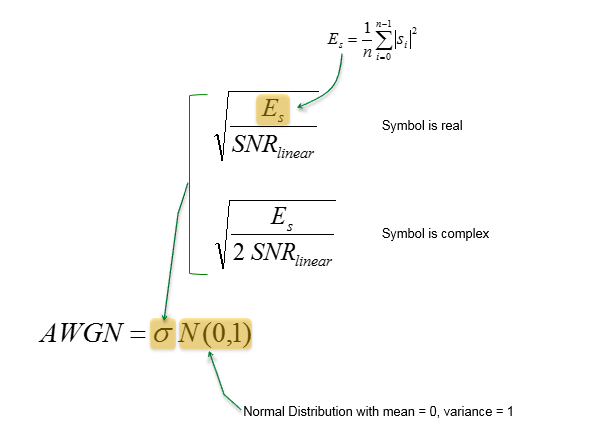
AWGN stands for Additive WhiteGaussianNoise. Actually this name itself has all the detailed information in it as follows.
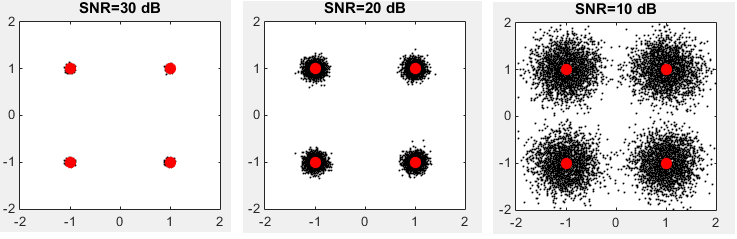
Some examples of the signal that are impacted by AWGN are as follows.
As you see here, the overall distribution of AWGN varies depending on SNR (Signal To Noise Ratio). Following equation shows the relationship between AWGN and SNR.
< List 1 > clear all;
% Number of symbols N = 10000;
% Specify SNR in dB. Try setting various different value here and see how the result changes SNR_dB = 10;
% Create a randomly generated QAM symbols s = (2*randi([0 1],1,N)-1)+j*(2*randi([0 1],1,N)-1);
% Calculate Symbol Energy Eavg = sum(abs(s) .^ 2)/N;
% Convert SNR (in dB) to SNR (in Linear) SNR_lin = 10 .^ (SNR_dB/10);
% Calculate the Sigma (Standard Deviation) of AWGN awgnSigma = sqrt(Eavg/(2*SNR_lin));
% Generate a sequence of noise with Normal Distribution and rescale it with the sigma awgn = awgnSigma*(randn(1,N)+j*randn(1,N));
% Add the noise to the original signal y = s + awgn;
% Plot the noised signal and the original signal plot(real(y),imag(y),'ko','MarkerFaceColor',[0 0 0],'MarkerSize',1); axis([-2 2 -2 2]); title(strcat('SNR=', num2str(SNR_dB), ' dB')); hold on; plot(real(s),imag(s),'ro','MarkerFaceColor',[1 0 0],'MarkerSize',8); axis([-2 2 -2 2]); hold off;
Reference :
|
||